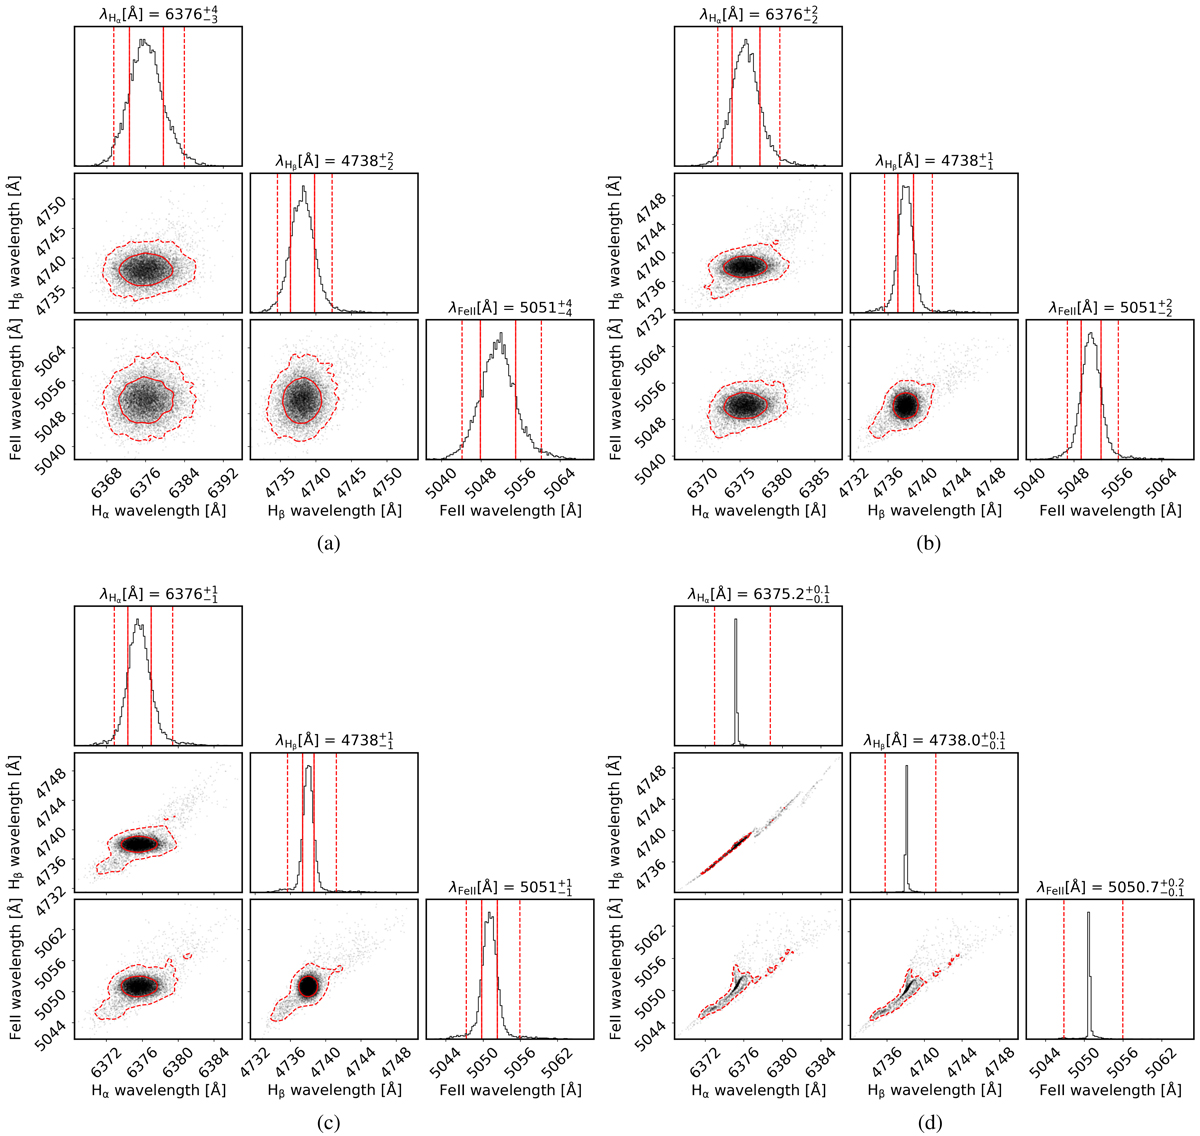
Fig. 11.
Download original image
Correlations between the absorption minima of Fe II, Hα, and Hβ at day 22 for the four investigated S/N: 10, 20, 30, and ∞. The solid 1σ contours in the 2D histograms contain 68% of the data and the dashed 2σ contours 95%. The 1D histograms contain the 1σ (vertical solid lines) and the 2σ (vertical dashed lines) ranges. For S/N = ∞ we only show the contour containing 95% of the data and the 2σ range. Above the 1D histograms the mean wavelength of the absorption minimum with 1σ uncertainties is indicated. While there are significant correlations in the absorption minima of the different lines in the case of noiseless spectra, the correlations become weak or negligible with noisy spectra. (a) S/N = 10. (b) S/N = 20. (c) S/N = 30. (d) S/N = ∞.
Current usage metrics show cumulative count of Article Views (full-text article views including HTML views, PDF and ePub downloads, according to the available data) and Abstracts Views on Vision4Press platform.
Data correspond to usage on the plateform after 2015. The current usage metrics is available 48-96 hours after online publication and is updated daily on week days.
Initial download of the metrics may take a while.