Fig. 9
Download original image
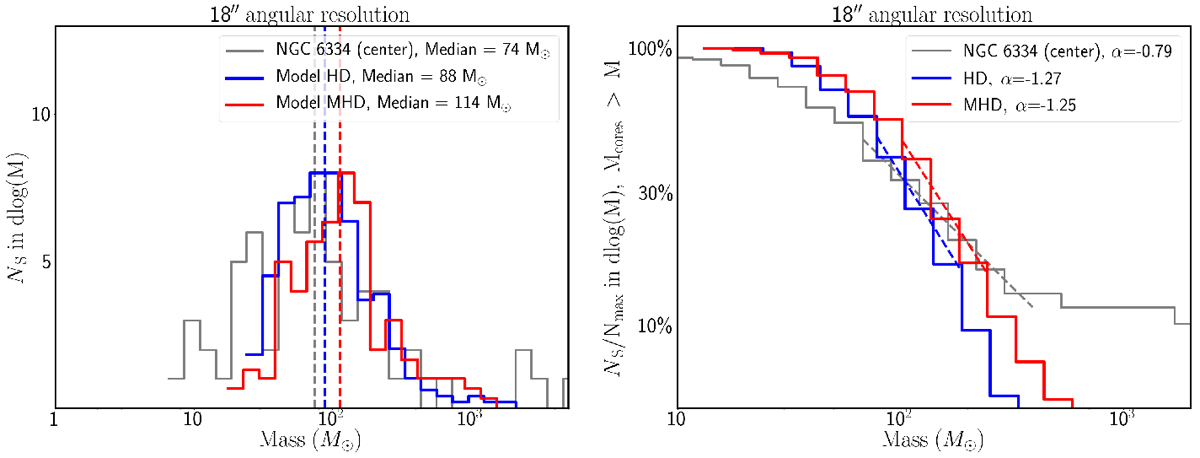
Comparisons of the mass functions at 18′′ of the bound sources extracted by getsf in the star-forming regions NGC 6334 with those extracted in the HD (blue) and MHD (red) simulations. In case of NGC 6334, only the sources from the central region (red box in Fig. 1) were used. The numbers of sources were normalised to the peak of the mass function for NGC 6334 and the fits of the cumulative mass function were done within the range 10−50%. In all modelhistograms, the numbers of sources were averaged between the x, y, and z projections.
Current usage metrics show cumulative count of Article Views (full-text article views including HTML views, PDF and ePub downloads, according to the available data) and Abstracts Views on Vision4Press platform.
Data correspond to usage on the plateform after 2015. The current usage metrics is available 48-96 hours after online publication and is updated daily on week days.
Initial download of the metrics may take a while.