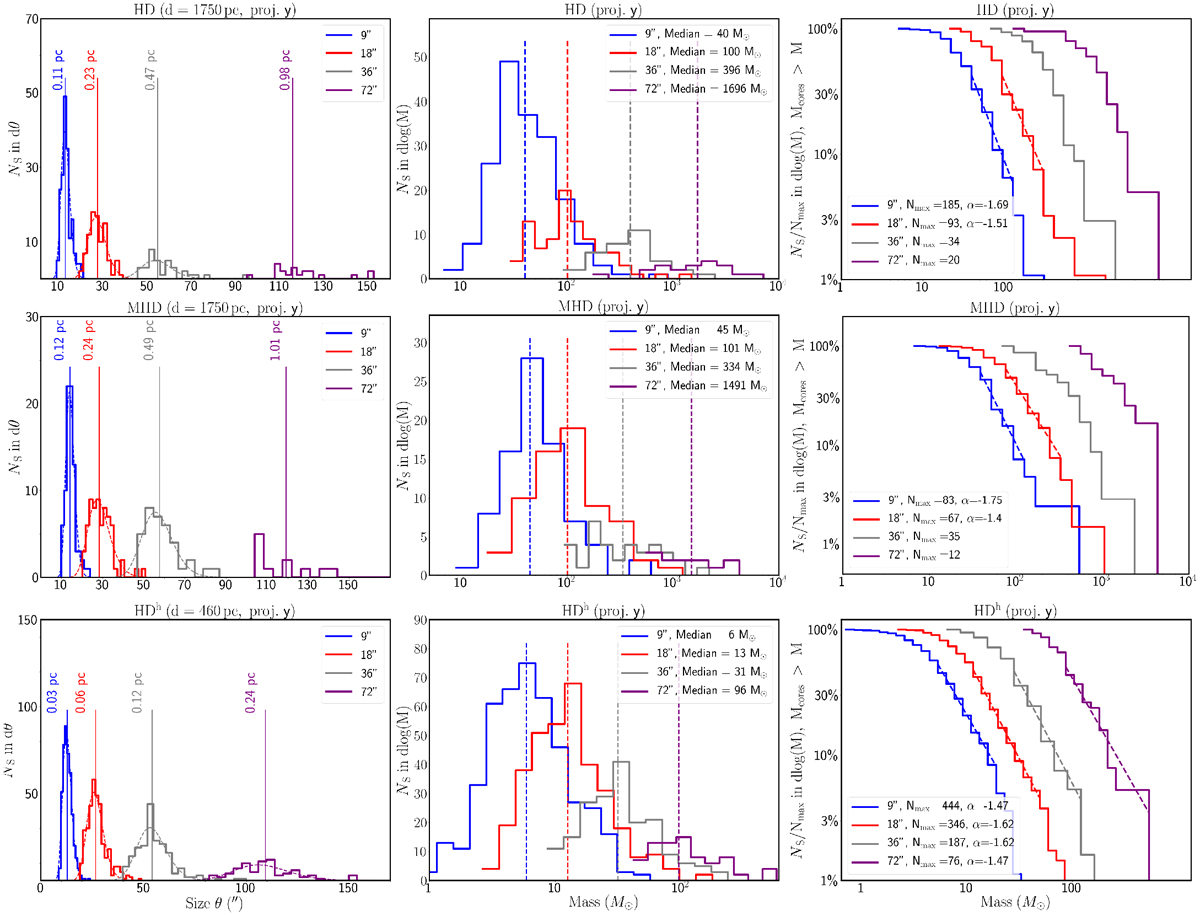
Fig. 7
Download original image
Effects of different angular resolutions on the sizes and masses of bound sources in the simulated star-forming regions HD (top), MHD (middle row), and HDh (bottom). We show the source size function (left), the source mass function (middle), and the cumulative mass function (right), obtained for the y projection of the respective column density maps. The other projections on the x and z directions are displayed in Figs. A.7 and A.8. The fits of the cumulative SMFs were done only for extractions with more than 40 bound sources. We fitted the cumulative SMFs in the mass range corresponding to 5–50% of the source samples; it corresponds to, from top to bottom: 40–128, 39–125, 5–19 M⊙ for the blue curves, 94–304, 76–329, 11–49 M⊙ for the red curves, 28–120 M⊙ for the grey curve, and 87–537 M⊙ for the purple curve.
Current usage metrics show cumulative count of Article Views (full-text article views including HTML views, PDF and ePub downloads, according to the available data) and Abstracts Views on Vision4Press platform.
Data correspond to usage on the plateform after 2015. The current usage metrics is available 48-96 hours after online publication and is updated daily on week days.
Initial download of the metrics may take a while.