Fig. 6
Download original image
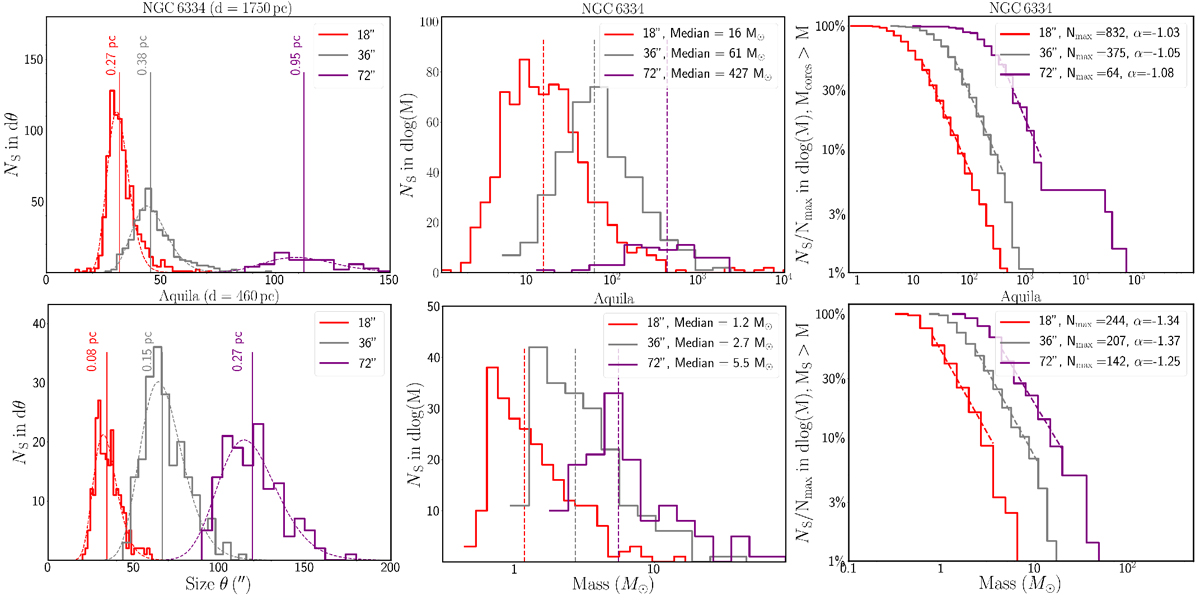
Effects of different angular resolutions on the derived sizes and masses of bound sources in the star-forming regions NGC 6334 (top) and Aquila (bottom). We show the source size function (left), the source mass function (middle), and the cumulative mass function (right). The dashed curves in the left panels are the lognormal fits to the source size distributions and the vertical lines indicate the median values for each distribution. The dashed lines in the right panels are the fits to the cumulative SMFs within the range 5− 50%. For NGC 6334 (resp. Aquila), these intervals correspond to 14–107 M⊙ (resp. 1–4) at 18′′, 54–418 M⊙ (resp. 2–11) at 36′′, and 323-1870 M⊙ (resp. 4–20) at 72′′.
Current usage metrics show cumulative count of Article Views (full-text article views including HTML views, PDF and ePub downloads, according to the available data) and Abstracts Views on Vision4Press platform.
Data correspond to usage on the plateform after 2015. The current usage metrics is available 48-96 hours after online publication and is updated daily on week days.
Initial download of the metrics may take a while.