Fig. 5
Download original image
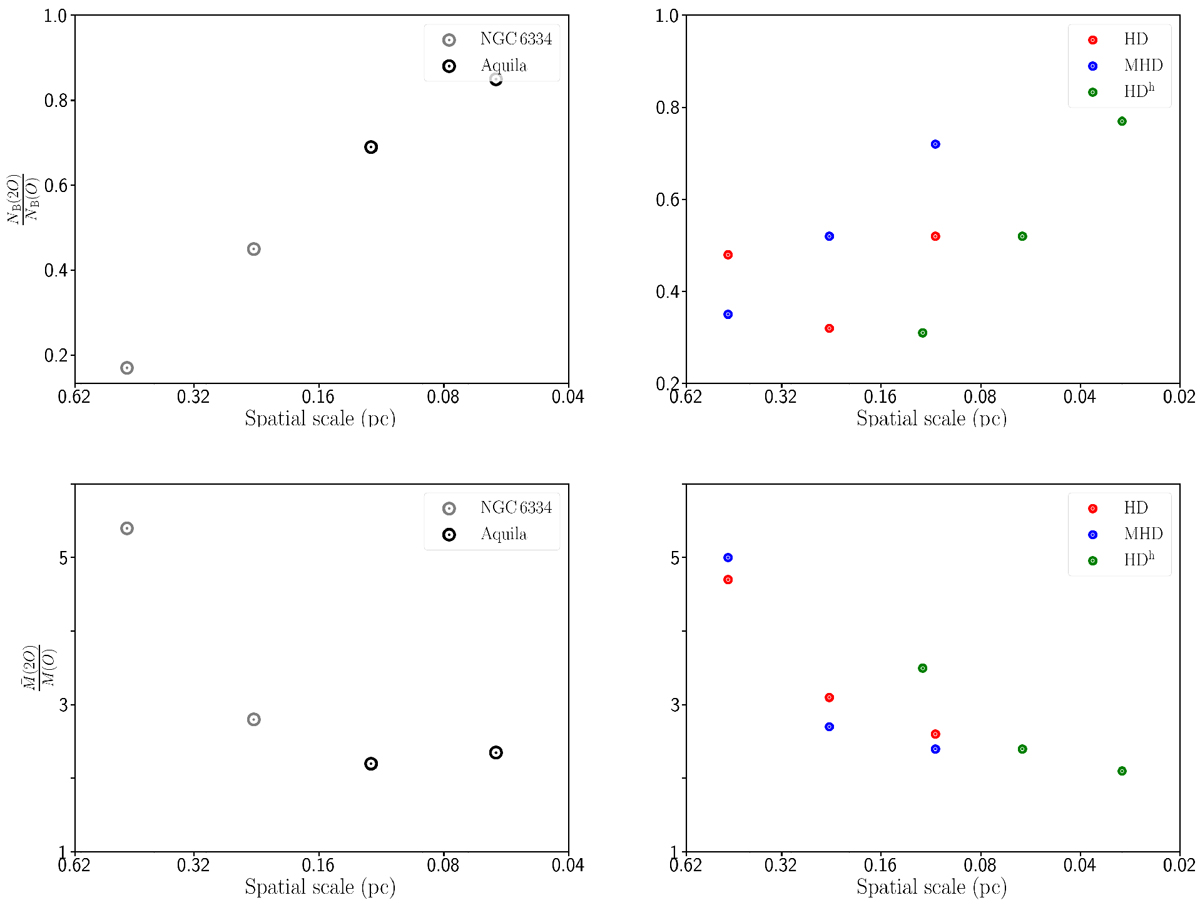
Each data point represents the ratio, R = F(2O)∕F(O), at the spatial resolutions O and 2O of either the number (top, F = NB) or mean mass (bottom, ![]() ) of sources, and plotted at the mean spatial resolution x = 3O∕2. The left panels correspond to the observations of Aquila and NGC 6334. The right panels correspond to the numerical models.
) of sources, and plotted at the mean spatial resolution x = 3O∕2. The left panels correspond to the observations of Aquila and NGC 6334. The right panels correspond to the numerical models.
Current usage metrics show cumulative count of Article Views (full-text article views including HTML views, PDF and ePub downloads, according to the available data) and Abstracts Views on Vision4Press platform.
Data correspond to usage on the plateform after 2015. The current usage metrics is available 48-96 hours after online publication and is updated daily on week days.
Initial download of the metrics may take a while.