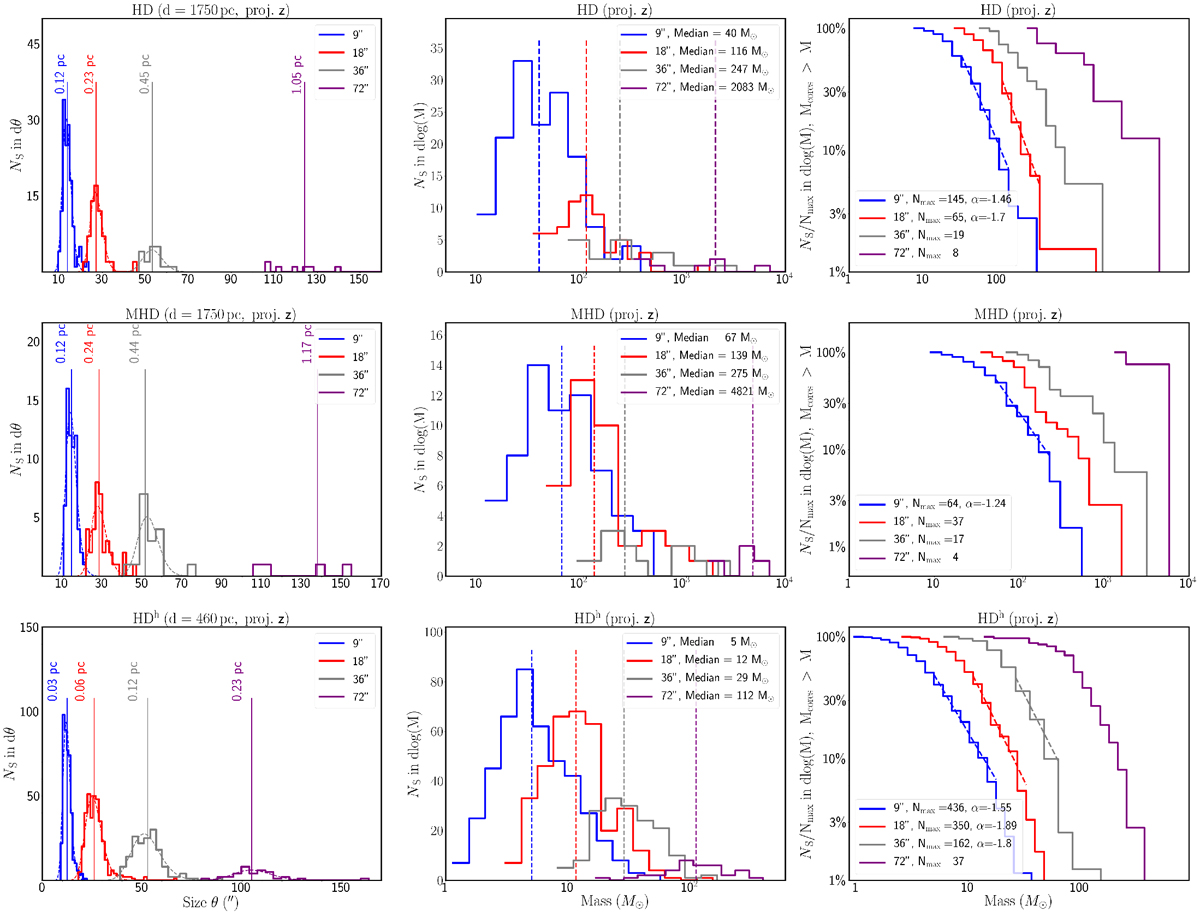
Fig. A.8
Download original image
Effects of different angular resolutions on the sizes and masses of the bound sources in the simulated star-forming regions HD (top), MHD (middle row), and HDh (bottom). We show the source size function (left), the source mass function (middle), and the cumulative mass function (right), obtained for the z projection of the respective surface density maps. The other projections on the x and y directions are displayed in Figs. 7 and A.7.
Current usage metrics show cumulative count of Article Views (full-text article views including HTML views, PDF and ePub downloads, according to the available data) and Abstracts Views on Vision4Press platform.
Data correspond to usage on the plateform after 2015. The current usage metrics is available 48-96 hours after online publication and is updated daily on week days.
Initial download of the metrics may take a while.