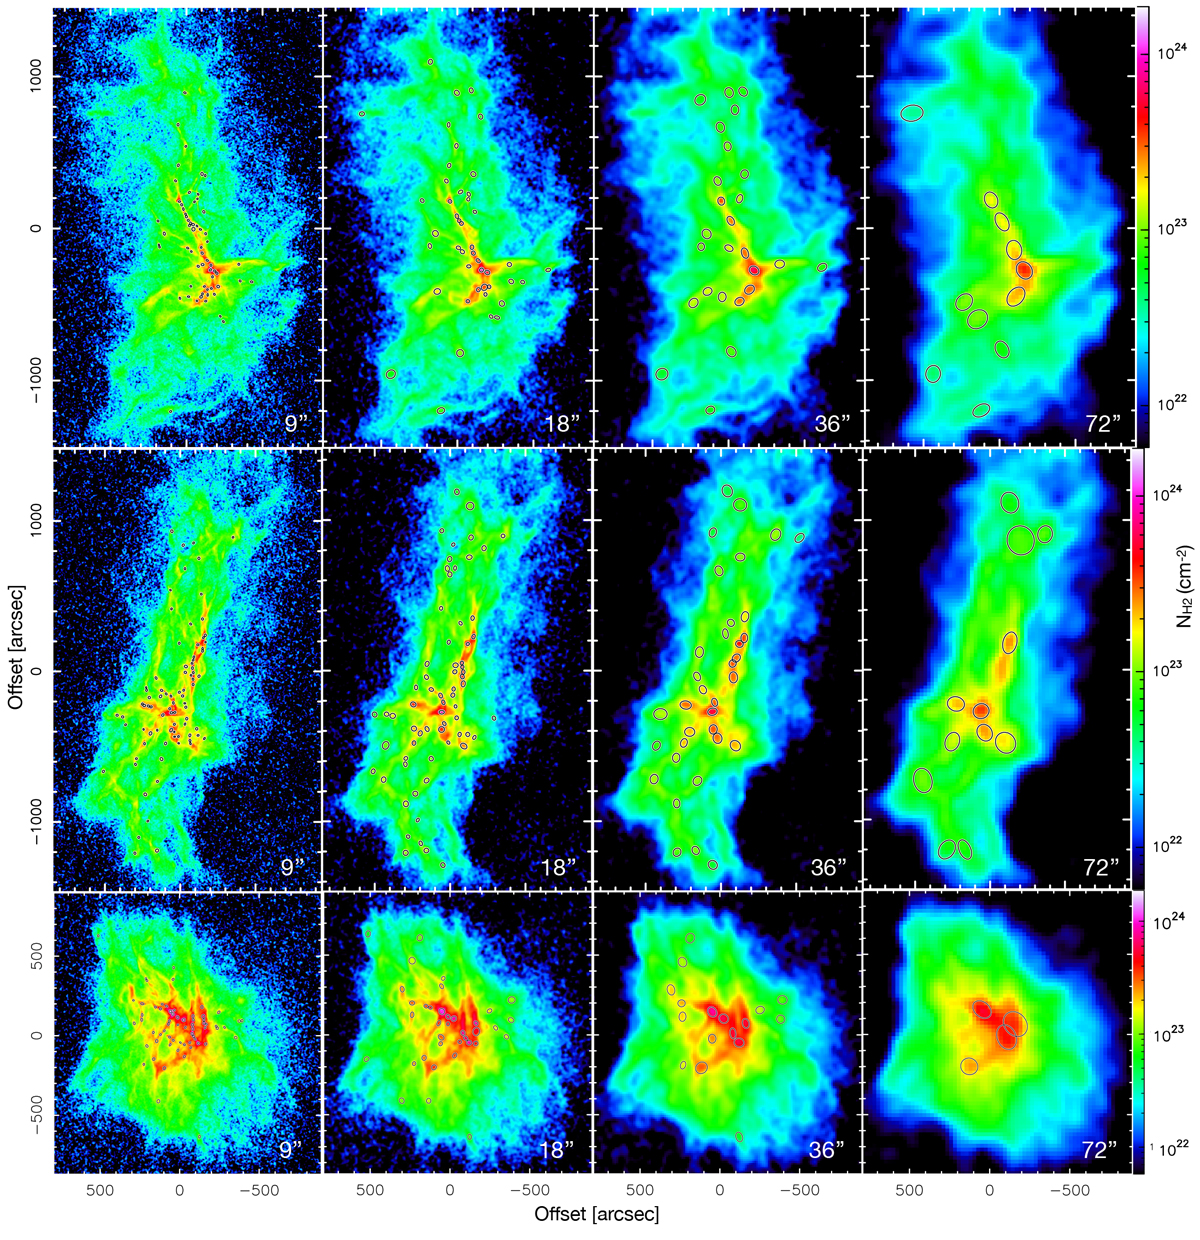
Fig. A.3
Download original image
Column densities in the MHD simulation projected along the x axis (top), y axis (middle) and z axis (bottom) with the angular resolution indicated in the panels, overlaid with half-maximum ellipses representing the bound sources extracted by getsf. The linear scales, corresponding to the resolutions, are 0.07, 0.15, 0.31, and 0.62 pc.
Current usage metrics show cumulative count of Article Views (full-text article views including HTML views, PDF and ePub downloads, according to the available data) and Abstracts Views on Vision4Press platform.
Data correspond to usage on the plateform after 2015. The current usage metrics is available 48-96 hours after online publication and is updated daily on week days.
Initial download of the metrics may take a while.