Fig. 7
Download original image
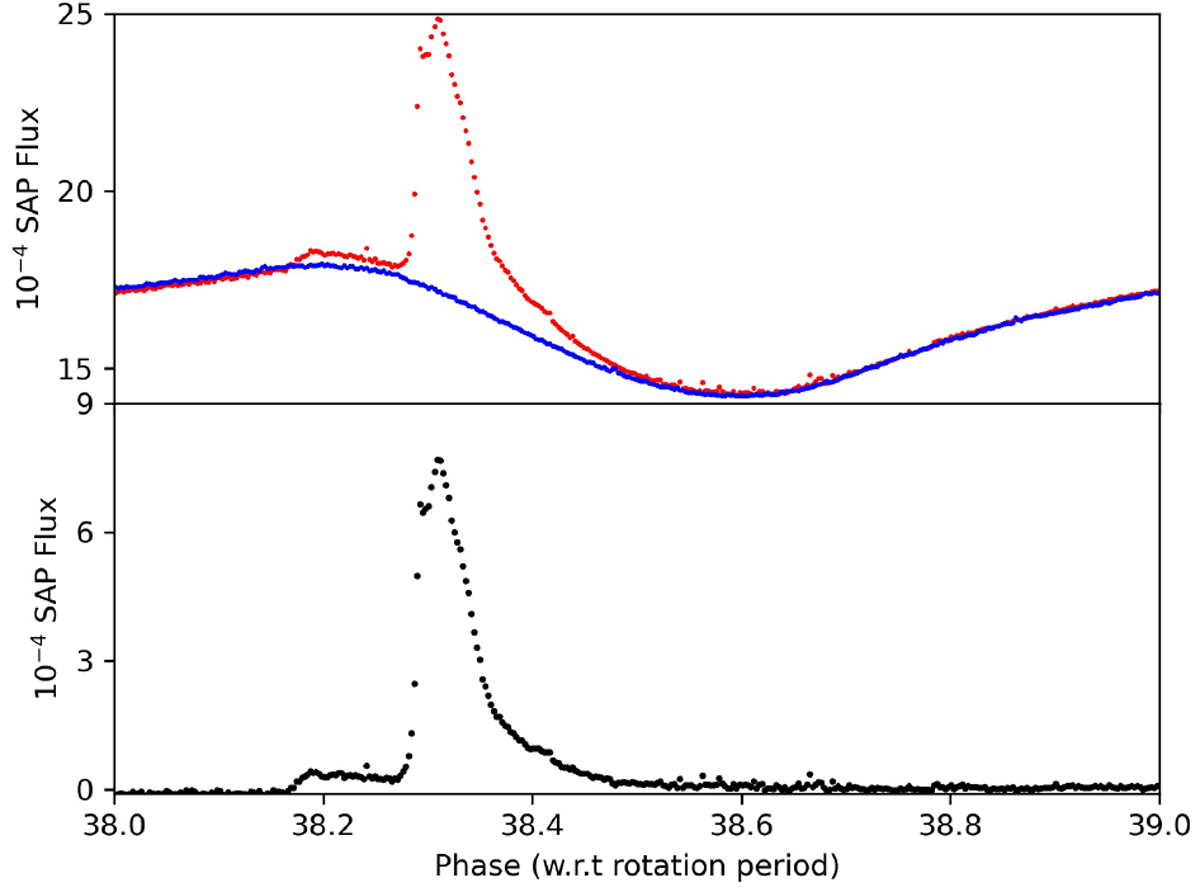
TESS light curve (in terms of 10−4 SAP flux) of the large flare on AB Dor, phased with rotation period. Upper panel: blue data points are the mean of the light curves in rotations before and after the flare, and the red data points are the rotation during the flare. Lower panel: net flare light curve.
Current usage metrics show cumulative count of Article Views (full-text article views including HTML views, PDF and ePub downloads, according to the available data) and Abstracts Views on Vision4Press platform.
Data correspond to usage on the plateform after 2015. The current usage metrics is available 48-96 hours after online publication and is updated daily on week days.
Initial download of the metrics may take a while.