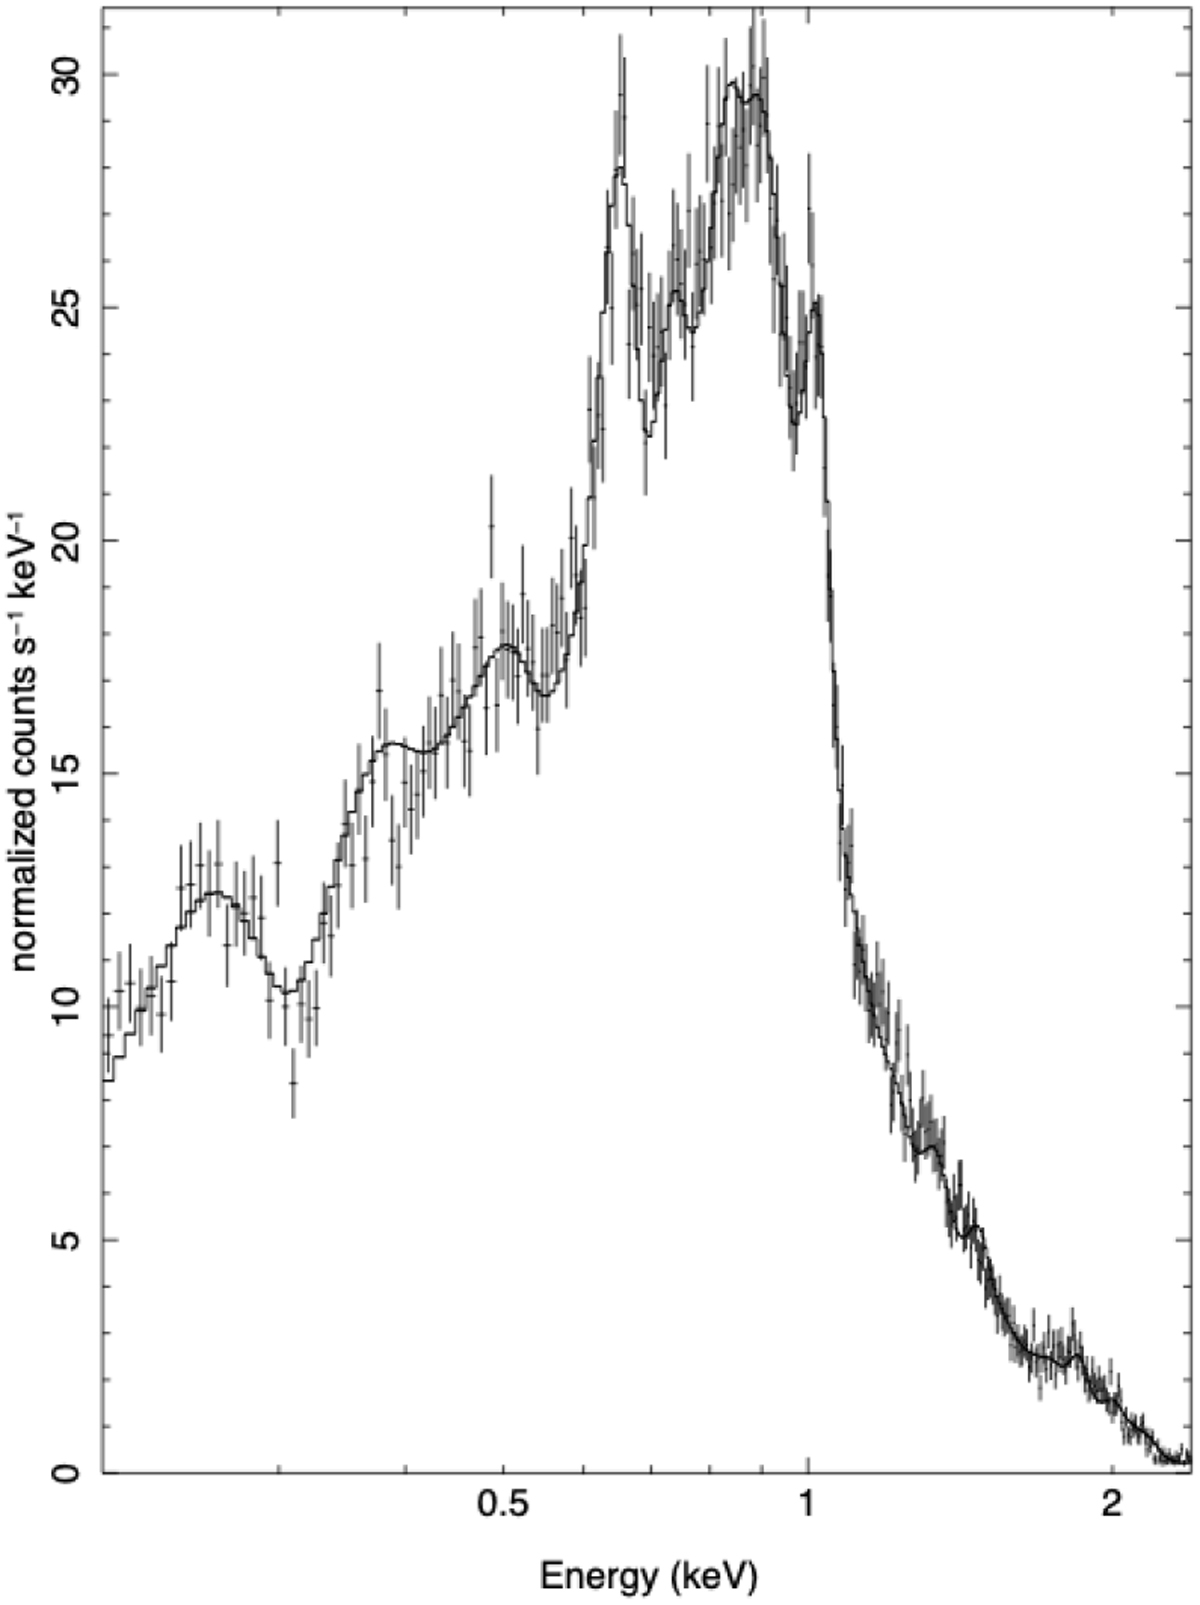
Fig. 5
Download original image
Scan-averaged quiescent X-ray spectrum of AB Dor (black data points) together with a model fit consisting of two isothermal plasma emission models (solid line); see text for more details.
Current usage metrics show cumulative count of Article Views (full-text article views including HTML views, PDF and ePub downloads, according to the available data) and Abstracts Views on Vision4Press platform.
Data correspond to usage on the plateform after 2015. The current usage metrics is available 48-96 hours after online publication and is updated daily on week days.
Initial download of the metrics may take a while.