Fig. 3
Download original image
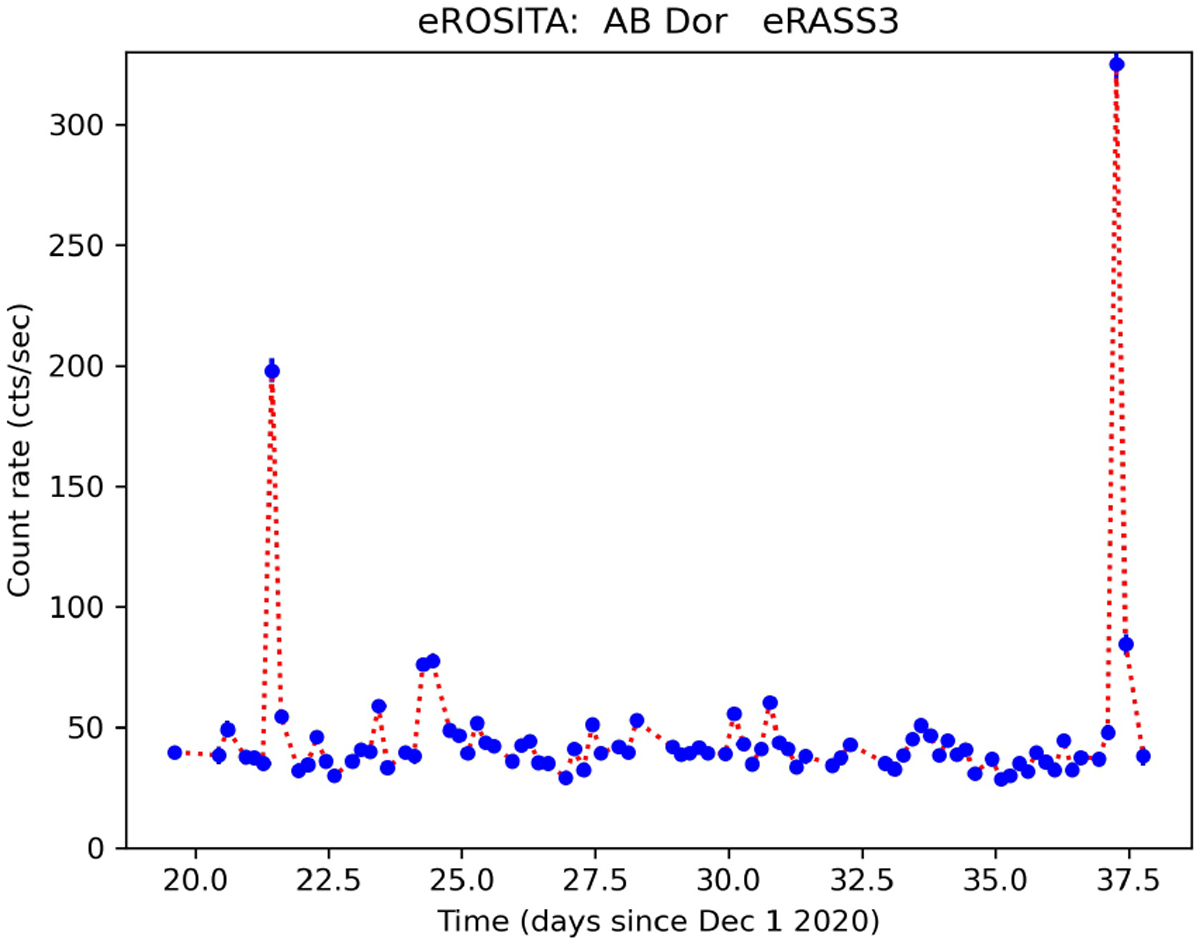
Scan-averaged AB Dor light curve obtained during eRASS3 in December 2020 and January 2021; blue dots: eROSITA data points, dashed red line connects adjacent data points for better visibility.
Current usage metrics show cumulative count of Article Views (full-text article views including HTML views, PDF and ePub downloads, according to the available data) and Abstracts Views on Vision4Press platform.
Data correspond to usage on the plateform after 2015. The current usage metrics is available 48-96 hours after online publication and is updated daily on week days.
Initial download of the metrics may take a while.