Fig. 11
Download original image
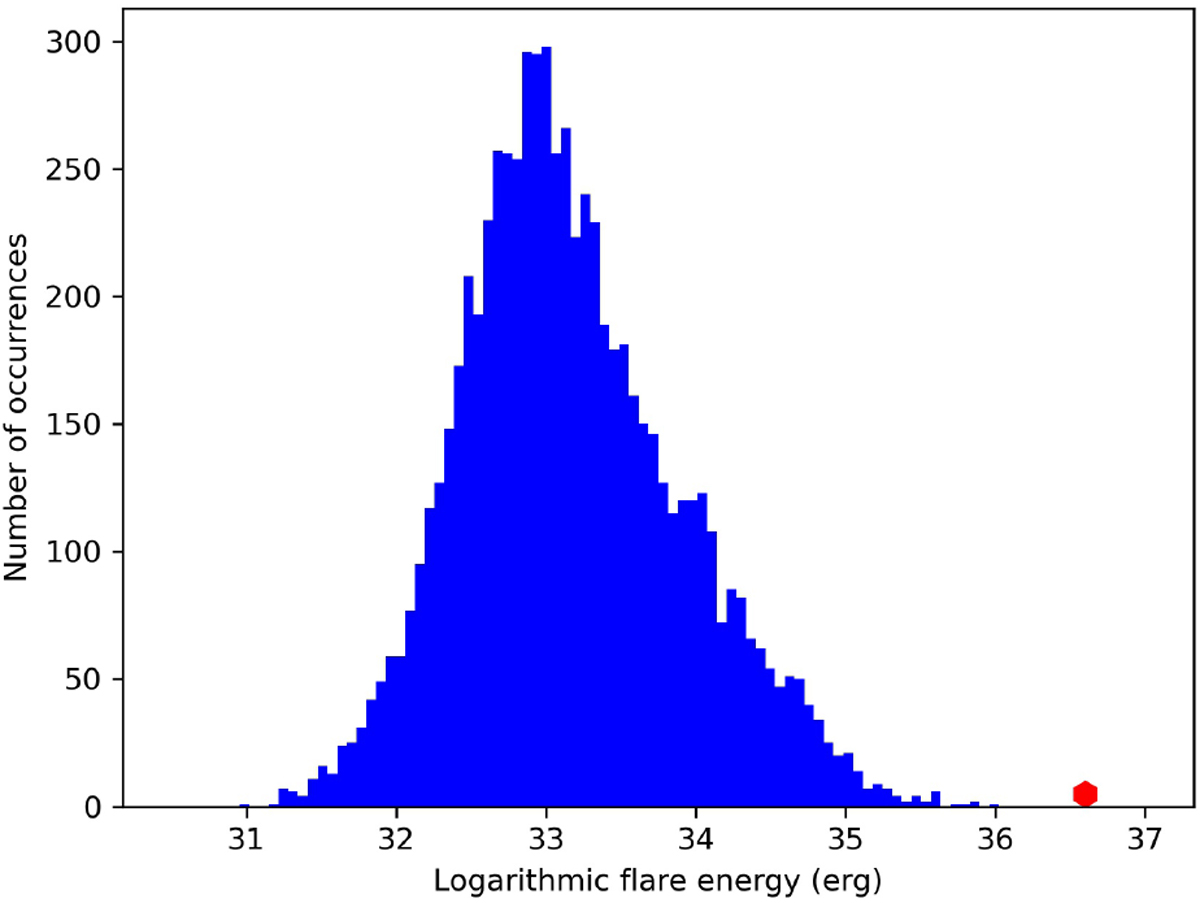
Histogram of total flare energy outputs from TESS measurements of 7074 flares on late-type stars (blue filled histogram, data taken from Günther et al. 2020) and the AB Dor flare from Jan. 7 (red hexagon, this paper); see text for more details.
Current usage metrics show cumulative count of Article Views (full-text article views including HTML views, PDF and ePub downloads, according to the available data) and Abstracts Views on Vision4Press platform.
Data correspond to usage on the plateform after 2015. The current usage metrics is available 48-96 hours after online publication and is updated daily on week days.
Initial download of the metrics may take a while.