| Issue |
A&A
Volume 652, August 2021
|
|
|---|---|---|
| Article Number | A24 | |
| Number of page(s) | 12 | |
| Section | Cosmology (including clusters of galaxies) | |
| DOI | https://doi.org/10.1051/0004-6361/202141056 | |
| Published online | 04 August 2021 | |
A galaxy cluster in the innermost Zone of Avoidance, close to the radio phoenix VLSS J2217.5+5943
1
Institut für Astrophysik, Universität Göttingen, Friedrich-Hund Platz 1, 37077 Göttingen, Germany
e-mail: This email address is being protected from spambots. You need JavaScript enabled to view it.
2
Thüringer Landessternwarte, Sternwarte 5, 07778 Tautenburg, Germany
3
Department of Astronomy and McDonald Observatory, University of Texas at Austin, 2515 Speedway, Austin, TX 78712, USA
4
Astronomisches Institut, Ruhr-Universität Bochum, Universitätsstrasse 150, 44801 Bochum, Germany
5
Hobby Eberly Telescope, University of Texas, Austin, TX 78712, USA
6
Centre for Astrophysics and Planetary Science, School of Physical Sciences, University of Kent, Canterbury CT2 7NH, UK
Received:
12
April
2021
Accepted:
17
May
2021
Abstract
Context. Galaxy clusters grow via mergers with other clusters and groups. Extended regions of diffuse radio emission with a steep radio spectral index are thought to be indicators of such merger events. Extended radio sources with a significantly curved spectrum and a complex morphology have been found in several galaxy clusters. It has been proposed that these so-called radio phoenices are witnesses of cluster mergers and of the presence of active galactic nuclei prior to the merger. Shock fronts or turbulence induced by the mergers are believed to reenergize plasma emitted in the past active phase of a galaxy.
Aims. The steep spectrum radio source VLSS J2217.5+5943 shows a complex filamentary morphology and a curved spectrum. Therefore, the source has previously been classified as a radio phoenix. However, no galaxy cluster associated with this radio source had confidently been detected until now because the source is located in the direction of the innermost zone of the Galactic plane at b = +2.4°, the innermost Zone of Avoidance (ZoA). The main aim of this work is to identify galaxies that are part of a cluster at the location of VLSS J2217.5+5943, determine their redshifts, and analyze their connection with the radio source. The confirmation of a cluster would corroborate the classification of the radio source as a radio phoenix and demonstrate that extended, diffuse radio sources are useful indicators of the presence of a galaxy cluster, in particular in the innermost ZoA.
Methods. We analyzed archival observations in the near infrared and mid infrared (Spitzer) to select the galaxies in the immediate neighborhood of the radio source. A sample of 23 galaxies were selected as candidate cluster members. Furthermore, we carried out deep integral field spectroscopy covering 6450 to 10 500 Å with the red unit of the Hobby-Eberly Telescope second generation low resolution spectrograph (LRS2-R). We also reanalyzed archival GMRT observations at 325 and 610 MHz.
Results. We selected 23 galaxies within a radius of 2.5 arcmin, centered on RA = 22h17m.5, Dec = +59° 43′ (J2000). Spectra were obtained for three of the brightest galaxies. For two galaxies we derived redshifts of z = 0.165 and z = 0.161, based on NaD absorption and TiO band heads. Their spectra correspond to E-type galaxies. Both galaxies are spatially associated with VLSS J2217.5+5943. The spectrum of the third galaxy, which is slightly farther from the radio source, indicates a LINER spectral type at z = 0.042. It is apparently a foreground galaxy with respect to the cluster we identified.
Conclusions. VLSS J2217.5+5943 is associated with a massive galaxy cluster at redshift z = 0.163 ± .003, supporting its classification as a radio phoenix. The intrinsic properties of the radio source, computed for the cluster redshift, are in good agreement with those of other known radio phoenices. The identification of the galaxy cluster demonstrates that far-red spectroscopy with LRS2-R succeeds in determining the redshift of galaxies in the innermost ZoA. Moreover, it confirms that radio sources can be useful indicators of the presence of galaxy clusters in the ZoA.
Key words: galaxies: clusters: general / radio continuum: galaxies / galaxies: active / large-scale structure of Universe
© ESO 2021
1. Introduction
Galaxies are arranged in groups, clusters, superclusters, and large-scale structures, such as filaments and walls. One challenge for tracing extragalactic structures is the strong extinction of stellar light from the ultraviolet to the infrared caused by interstellar dust particles in our Galaxy. The strong concentration of the interstellar dust toward low Galactic latitudes, |b| < 10deg, leads to the well-known phenomenon of the so-called Zone of Avoidance (ZoA; e.g., Kraan-Korteweg 2005). For example, it has been demonstrated that the Milky Way disk obscures the central part of the dynamically important Great Attractor region (Dressler et al. 1987) as well as the Perseus-Pisces Supercluster (Giovanelli & Haynes 1982). In recent years, more comprehensive catalogs of galaxies in the ZoA have been produced: the 2MASS redshift survey (2MRS; Macri et al. 2019; Lambert et al. 2020) and the Zone of Avoidance catalog of 2MASS bright galaxies (see Schröder et al. 2019a and references therein). The 2MRS aims to map the three-dimensional distribution of an all-sky flux-limited sample of ∼45 000 galaxies. Nevertheless, redshifts are missing for ∼18% of the catalog entries that are located within the ZoA, and nothing is known about galaxies in the innermost ZoA, defined as |b| < 8° for −30° < l < 30° and |b| < 5° otherwise (Macri et al. 2019). Further catalogs are based on the 21 cm HI emission line: the Nancay HI Zone of Avoidance survey of 2MASS bright galaxies (Kraan-Korteweg et al. 2018) and the Effelsberg Bonn HISurvey (EBHIS) a catalog of HI-detected galaxies in the northern ZoA (Schröder et al. 2019b). However, still very few galaxy redshifts are known for objects at the lowest Galactic latitudes for |b| < 5° (see Fig. 12 in Lambert et al. 2020).
Galaxy clusters in the ZoA have also been searched for in the X-ray band; this was done by Kocevski et al. (2007), who identified candidates in the ROSAT All-Sky Survey and then targeted related galaxies in spectroscopic follow-up observations. The authors report 57 galaxy clusters with |b| < 20° in the second flux-limited Clusters in the Zone of Avoidance (CIZA) survey cluster catalog, 13 of which are located in the ZoA as defined above and four in the innermost ZoA.
Even though radio waves are much less affected by interstellar dust, the investigation of extragalactic radio sources in the innermost ZoA is greatly hampered by the difficulty in identifying optical counterparts (and thus obtaining redshifts). The radio source 24P73, comprising the extended emission source VLSS J2217.5+5943 at  , was first described in detail by Green & Joncas (1994) based on follow-up observations of a few promising sources taken from the second Dominion Radio Astrophysical Observatory survey of the northern Galactic plane at 408 MHz and 1.42 GHz (Higgs & Joncas 1989). 24P73 was selected because of its unusually steep radio spectrum. Green & Joncas (1994) pointed out that 24P73 is similar to another ultra steep spectrum source, 26P218, which is also at low Galactic latitude. These authors suggested that both 24P73 and 26P218 might be of extragalactic origin, namely radio halos or relics located in galaxy clusters, rather than being galactic pulsars, as previously suggested. On the other hand, they found it surprising to detect two such rare ultra steep spectrum sources close to the Galactic plane. The subsequent study by Green et al. (2004) confirmed that 26P218 (also known as WKB 0314+57.8) is most likely related to a galaxy cluster at z ≈ 0.8, reddened by about 6 mag of visual extinction in the ZoA. However, the existence of a galaxy cluster related to 24P73 has not yet been verified.
VLSS J2217.5+5943 was included in a study of 26 diffuse steep spectrum sources by van Weeren et al. (2009) that presented 610 MHz observations with the Giant Metrewave Radio Telescope (GMRT). The main aim of this project was to determine the morphology of the sources and search for diffuse structures that could be associated with shock fronts or turbulence in clusters. These authors confirmed that VLSS J2217.5+5943 has an extremely steep spectrum at rest frequencies higher than about 300 MHz and a flatter spectrum at lower frequencies. Moreover, they suggested that the source is a so-called radio phoenix, that is a diffuse radio source where the particle acceleration is thought to be due to a large shock wave adiabatically compressing fossil plasma emitted by an active galactic nucleus (AGN) and still comprising mildly relativistic electrons. However, CIZA did not report any galaxy cluster at the location of 24P73, and no optical galaxies could be identified. In a subsequent study, van Weeren et al. (2011) followed up with radio continuum observations at 325 MHz and 1.4 GHz as well as optical imaging with the William Herschel Telescope, which revealed several faint red galaxies. Using the Hubble-R relation, a redshift of z = 0.15 ± 0.1 was estimated. The authors confirmed the classification of VLSS J2217.5+5943 as a radio phoenix. They also emphasized that deep near-infrared (NIR) imaging will be necessary to confirm the presence of a cluster. Recently, Chandra observations of VLSS J2217.5+5943 revealed extended diffuse X-ray emission (Mandal 2021), which provides further evidence for the presence of a galaxy group or cluster.
In the present study we used archival imaging observations in the NIR and mid infrared (MIR) to select galaxies in the field of VLSS J2217.5+5943. Of course, spectroscopic redshifts are of crucial importance for the interpretation of that galaxy sample. Despite the enormous advances in exploring galaxies in the ZoA, no spectroscopic redshifts of galaxies have been reported so far for this sky region. We present spectra of three galaxies obtained with the new second generation low resolution spectrograph, the LRS2 (Chonis et al. 2016), on the upgraded 10 m Hobby-Eberly Telescope (HET; Hill et al. 2018). This paper is structured as follows. In Sect. 2 we describe the imaging observations and the construction of the galaxy sample. In Sect. 3 we present the spectroscopic observations and data analysis. In Sect. 4 we present the radio data analysis. Section 5 is devoted to the description of the galaxy cluster, including a rough estimate of the cluster mass. The results are summarized in Sect. 6. We assume Λ cold dark matter cosmology with H0 = 73 km s−1 Mpc−1, ΩΛ = 0.73, and ΩM = 0.27.
2. Imaging
2.1. Selection of galaxies from UGPS
We extracted NIR images in J, H, and K of the field around 24P73 from the Galactic Plane Survey (UGPS; Lucas et al. 2008) of the United Kingdom Infrared Deep Sky Survey (UKIDSS; Lawrence et al. 2007). The survey utilized the Wide Field Camera (WFCAM; Casali et al. 2007) on the United Kingdom Infrared Telescope (UKIRT). The photometric system and the science archive are described in Hewett et al. (2006) and Hambly et al. (2008). UGPS observations were conducted with exposure times of 80, 80, and 40 s in J, H, and K, respectively. This leads to typical 5σ detection limits of J = 19.7, H = 19.0, and K = 18.05 (Warren et al. 2007). The 0.4 arcsec pixel size of WFCAM was combined with micro-stepping observations, leading to 0.2 arcsecond pixels in the final images, with typical seeing being better than 0.8 arcseconds. This combination of depth and resolution markedly improved on 2MASS sensitivity (Skrutskie et al. 2006), especially in the crowded fields near the Galactic plane. The astrometry is anchored to 2MASS, and the typical precision for unblended bright stars is 0.1 arcsec r.m.s. (Dye et al. 2006). The images of the field of 24P73 in H and K were taken on October 24, 2011, and the J images in part on that day and in part on October 23, 2011. The seeing in the images is on the order of 0.9 arcsec. The UGPS images of this field were downloaded from the Wide Field Camera Science Archive (WSA) database1. All data were stacked to obtain the deep images shown in this work using the image mosaic engine Montage2.
Figure 1 shows the 5′×5′ red-green-blue (RGB) color image (red = K, green = H, blue = J) centered on the coordinates of the radio source 24P73 (RA =  , Dec = +59° 43′, J2000). The diameter of the radio source is about 2 arcmin. The image clearly reveals a concentration of extended, nonstellar objects toward the center. Furthermore, extragalactic sources beyond the screen of interstellar dust in our Galaxy are conspicuously indicated by their red color, which is caused by the strong interstellar reddening in the inner ZoA. In this way, combining morphological and color information, we initially identified 16 galaxies simply by the visual inspection of Fig. 1. In the next step, we used a morphology-color diagram (Fig. 2) with the UKIDSS parameter mergedClassStat as an indicator of the extension of the sources. Objects classified as star-like (pStar > 0.9, black) in the UKIDSSDR11PLUS database are clustered around mergedClassStat = −2 and J − K = 0.8, whereas objects classified as galaxies (pGalaxy > 0.9, red) have mergedClassStat > 0. The visual inspection indicates that sources with mergedClassStat > 0 and J − K ≲ 1.5 are most likely blended stars. On the other hand, all galaxies from our eyeball selection were found to be located in the sparsely populated top right corner of the diagram. Hence, we used their positions to define the locus of distant galaxies in that diagram (dashed red lines). Some faint objects close to the demarcation lines but outside the selection area may be galaxies of small angular size. In particular, the two objects marked as red plus signs very close to the dashed line are most likely such faint galaxies. We did not wish to extend the selection toward very small galaxies mainly because of the increasing contamination by background galaxies that are not spatially connected to the brighter galaxies in our sample.
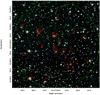 |
Fig. 1. RGB composite of the central 5′×5′ field around the position of the radio source 24P73 ( |
All together, we selected 23 extragalactic systems, which constitute the galaxy sample for the present study. The galaxies are listed in Table 1 with the data from the UKIDSSDR11PLUS database3. Unfortunately, model magnitudes, as defined by the Sloan Digital Sky Survey (SDSS), are not computed by UKIDSS. Here, we use Petrosian magnitudes, which are known to not significantly depend on galaxy light profiles. The absolute magnitudes listed in the last column were computed assuming z = 0.042 for G2 and z = 0.163 (Sect. 3) for all other galaxies using foreground reddening corrections with E(B − V) = 1.8 and k corrections from Chilingarian & Zolotukhin (2012). We further assumed that the majority of these galaxies represent a coherent structure. The incompleteness of the galaxy sample and its “contamination” by foreground and background galaxies are discussed in Sect. 5.4. We note that Fig. 2 shows only 20 galaxies in the selection area because the heavily blended galaxy G21 is missing and J magnitudes are unavailable for G4 and G12 in the UKIDSSDR11PLUS database. It must further be noted that the cataloged magnitudes should be interpreted with caution because most galaxy images are blended by foreground stars.
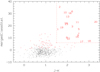 |
Fig. 2. Morphology-color diagram for 658 UKIDSSDR11PLUS sources with J < 19.5 and K < 19.5 in the 24 square arcmin field around VLSS J2217.5+5943. The color index J − K is computed from the Petrosian magnitudes. Black and red symbols indicate sources classified as star-like or as galaxies, respectively. The dashed lines mark the selection area for the galaxies in the present study. |
Positions, observed Petrosian K magnitudes, J − K colors, and absolute K magnitudes for the 23 selected galaxies.
2.2. Spitzer Mapping of the Outer Galaxy
The VLSS J2217.5+5943 field was covered by the Spitzer Mapping of the Outer Galaxy (SMOG; Carey et al. 2008) project as part of the Galactic Legacy Infrared Midplane Survey Extraordinaire (GLIMPSE). SMOG used the Spitzer Space Telescope (SST; Werner et al. 2004) Infrared Array Camera (IRAC; Fazio et al. 2004) in the “Cryogenic(Cold) Mission” program phase. IRAC mosaic images in the four bands I1 to I4 at 3.6, 4.5, 5.8, and 8.0 μm with a pixel size of  are available from the GLIMPSE pages4 at the NASA/IPAC Infrared Science Archive (IRSA). We could easily identify all galaxies from Table 1 in the images in the I1 and I2 bands, whereas only the brightest galaxies are (barely) seen in the I3 and I4 bands. We show in Sect. 5 the stack of the images from I1 and I2 for the field of the extended radio source 24P73. Compared to the UGPS image, the galaxies appear slightly larger in the IRAC images (i.e., their extensions can be traced down to fainter surface brightness structures; see Sect. 5).
2.3. Optical surveys
None of the selected galaxies is clearly visible in the images from the ESO Digitized Sky Surveys (DSS), indicating that they are fainter than about the 20th magnitude in the optical. Deeper images in optical bands are available from the Panoramic Survey Telescope and Rapid Response System (Pan-STARRS or PS1; Chambers et al. 2019; Flewelling et al. 2020) located at Haleakala Observatory, Hawaii, and from the INT/WFC Photometric H-Alpha Survey (IPHAS) of the northern Galactic plane (Barentsen et al. 2014).
The PS1 catalog includes measurements in five filters (grizy)PS1 that cover the entire sky north of δ = −30° (3π survey) down to rP1 ≈ 23.3. The data are available through the MAST system at the Space Telescope Science Institute5. With the exception of the faintest galaxies (G1, G4, and G12) and the strongly blended G21, all galaxies from Table 1 were identified in PS1, albeit relatively close to the survey limit. The bright galaxy G13, for example, is listed with an aperture magnitude of rPS1 = 22.7 ± 0.1, but the Kron r magnitude was not measured.
For completeness, we also mention the 1860 square degree imaging survey IPHAS of the northern Milky Way in the broadband r and i and narrowband Hα filters using the Wide Field Camera on the 2.5 m Isaac Newton Telescope in La Palma. The observations were carried out at a median seeing of 1.1 arcsec and to a mean 5-sigma depth of 21.2 (r), 20.0 (i), and 20.3 (Hα). The search for the galaxies from Table 1 in the IPHAS DR2 Source Catalogue (Barentsen et al. 2014) yielded a detection only for the brightest galaxy, G2. All other galaxies from Table 1 have no IPHAS counterparts, neither in the catalog nor in the images.
2.4. Photometric redshift
The galaxy G13 is, along with G6, the second brightest in the K band. Unlike most of the other galaxies, G13 is not blended much by foreground stars and is thus suitable for a study of its spectral energy distribution (SED). Figure 3 shows the SED based on broadband magnitudes from Pan-STARRS and UGPS as well as fluxes from Spitzer IRAC6. The difficulty in such an approach is that the different surveys provide different types of measurements for extended sources: Kron magnitudes, Petrosian magnitudes, and aperture magnitudes for different aperture sizes, which are not directly comparable with one another. To tackle this problem, we measured the radial surface brightness profile on the IRAC 1+2 image (Sect. 5) and assumed that the profile is similar in the other bands. This profile was then used to extrapolate the measured flux in the largest aperture to the maximum size of the measured profile.
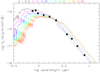 |
Fig. 3. Observed SED of G13 (black squares) based on corrected aperture magnitudes from Pan-STARRS rzy, UKIDSS JHK, and the four Spitzer IRAC bands corrected for Galactic interstellar extinction with E(B − V) = 2. The formal error bars for the photometric uncertainties are smaller than the symbol size. For comparison, the redshifted template spectrum of a 13 Gyr old E galaxy from Polletta et al. (2007) is overplotted for z = 0.0 − 0.90 in steps of 0.15 (colors). |
The observed SED had to be corrected for reddening by Galactic dust, which is crucial for fields deep in the ZoA. The IRSA Galactic Dust Reddening and Extinction Service7 gives  (Schlafly & Finkbeiner 2011). However, there is a large degree of uncertainty in these values as there is – looking through multiple spiral arms – the possibility of multiple dust temperature distributions or variable grain sizes close to the mid-plane of the Milky Way. As noted by IRSA8, “the user of this service is advised to use caution when working deep in the Galactic plane.” At this point we used E(B − V) just as a free parameter to check whether the SED is consistent with the z ≈ 0.15 from van Weeren et al. (2011). Figure 3 shows the de-reddened SED for E(B − V) = 2 compared with the template SED of a 13 Gyr old E galaxy from the Sirtf Wide-Area Infrared Extragalactic Survey (SWIRE) library9 (Polletta et al. 2007) for different redshifts, z = 0…0.9. At each z, the template was fit to the observed SED using the least squares method. The best agreement is found for z ≈ 0.15 (magenta spectrum). Of course, the resulting z depends strongly on the adopted value for E(B − V), with higher z for smaller E(B − V).
3. Spectroscopy
As mentioned in Sect. 1, the spectra and redshifts of the galaxies in the field of 24P73 are not contained in any 2MRS (e.g., Lambert et al. 2020). Furthermore, they are not listed in HI surveys of objects in the ZoA: neither in the Nancay HI Zone of Avoidance survey of 2MASS bright galaxies (Kraan-Korteweg et al. 2018) nor in the catalog of EBHIS HI-detected galaxies in the northern ZoA (Schröder et al. 2019b). We selected three galaxies, G2, G6, and G16, which are among the brightest in the K band in our sample, with the aim of obtaining spectroscopic redshifts.
3.1. Observations and data reduction
We used the red unit of the LRS2 (Chonis et al. 2016) on the upgraded HET. The HET is one of the world’s largest optical telescopes, with an aperture of 10 meters, located at the McDonald Observatory in the Davis Mountains, west Texas, USA. The LRS2 is an integral field spectrograph with four spectral channels that cover 3700 Å to 10 500 Å in separate blue and red units (LRS2-B and LRS2-R, respectively), each fed by lenslet-coupled fiber integral field units (IFUs). Each IFU covers 12″ × 6″ with 0.6″ spatial elements and full fill factor, and couples to 280 fibers. The IFUs are separated by 100″ on sky, but for this study we utilized only the LRS2-R unit, which simultaneously covers the wavelength range from 6450 to 8420 Å and 8180 to 10 500 Å (referred to as the red and far-red channels, respectively) at a resolution of R ∼ 2500. This wavelength range is split into the two spectral channels with a transition at 8350 Å by a dichroic beam splitter in the IFU. We obtained LRS2-R spectra of the three galaxies at several epochs between June 2017 and August 2020. The spectra were taken in blind-offset mode by means of optical reference stars observed in the acquisition camera. Table 2 gives the log of our spectroscopic observations. All spectra were taken with identical instrumental setups and at the same airmass, owing to the particular design of the HET, with fixed altitude.
Log of spectroscopic observations.
The 280 fiber spectra in each of the red and far-red channels of LRS2-R were reduced with the automatic HET pipeline, Panacea10. This pipeline performs basic CCD reduction tasks, wavelength calibration, fiber extraction, sky subtraction, and flux calibration. The initial sky subtraction from the automatic pipeline removes a single sky model from each fiber; although this is adequate for many science objectives, the strong OH sky lines, the spatially extended targets, and the wavelength-dependent spectrograph resolution require a sky residual model to identify the redshifts of our candidate galaxies. We used arc lamp exposures to build a basis of eigenvectors for a principal component analysis of the sky residuals similar to that of Soto et al. (2016). We identified our galaxies in each observation, masked a  region around the galaxies, and fit the sky residuals over the wavelengths of strong OH emission for the remaining fibers (typically around 200 fibers). The best fit components were then used for the masked fiber sky residuals as well. This greatly improved the sky subtraction. We extracted each spectrum using a two-dimensional Gaussian model. We normalized each spectrum for a given galaxy to the mean of the individual spectra and co-added each normalized individual spectrum. We modeled telluric absorption using a single telluric standard star. The HET always observes at nearly the same elevation, allowing for a single telluric model to have greater applicability than other telescopes. Although the telluric H2O features vary from observation to observation, the O2 features are more stable.
3.2. Results
Figure 4 shows the smoothed observed spectra of G2 (black), G6 (green), and G16 (red). The smoothing was performed using a simple moving average with a box size of 15 Å. For further analysis, we corrected our spectra for interstellar absorption by the Milky Way. Based on a comparison of the slope of our smoothed and de-reddened spectra of G6 and G16 with an elliptical template spectrum, we adopted E(B − V) = 1.8.
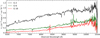 |
Fig. 4. Smoothed LRS2 spectra of the galaxies G2 (black), G6 (green), and G16 (red). |
We present spectral sections around NaD and the titanium oxide (TiO) bands for G6 and G16 in Fig. 5 and the sections around Hα and the Ca II infrared triplet for G2 in Fig. 6. As described above, the spectra have been smoothed and de-reddened. In addition, each spectral section was scaled in order to match the spectral features (see below for more details).
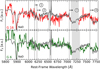 |
Fig. 5. Red to far-red spectra of galaxies G16 (red) and G6 (green) and of an elliptical template spectrum (gray) from 5800 to 7800 Å (rest frame). The NaD absorption and the band heads of TiO at λ6158 (1), λ6216 (2), λ7053 (3), and λ7589 (4) are marked. The region around the [N II] and Hα emission complex of the template galaxy is shaded in gray because it coincides with the strong telluric A-band (7590–7660 Å) in the observed frame. A region around 7200 Å corresponding to roughly 8370 Å in the observed frame, which is close to the wavelength of the dichroic filter transition between the two channels and is also contaminated by night-sky emission lines, is also shaded in gray. |
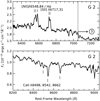 |
Fig. 6. Sections around the Hα region and the TiOλ7053 band head (3), as well as around the Ca II infrared triplet of G2. |
3.3. Redshift determination
As a first step, we tried to derive the galaxy redshifts by comparing the observed overall optical to far-red spectrum with a redshifted template. We used the template of an elliptical galaxy from the SDSS (DR5, spectral template 24; Strauss et al. 2002) because both the images (Sect. 5) and the spectral characteristics indicate that G6 and G16 appear to be of type E. The resulting difference spectrum between the observed galaxy spectra and the redshifted template spectrum had to yield a smooth curve for a correct redshift value. Moreover, the general intensity distribution of the difference spectrum should only reproduce the reddening by the Milky Way. In this way, we derived a first estimate of z = 0.16 ± 0.04.
In a second step, we derived the redshifts based on spectral features to confirm our first rough estimation. In addition to the NaDλ5892 absorption, the far-red spectra of elliptical galaxies are dominated by TiO bands from 6000 to 9000 Å (e.g., Kinney et al. 1996). These TiO bands are caused by the superposition of K5 to M9 stellar spectra. Spectra of those types are shown, for example, in Kirkpatrick et al. (1991). Some of the strongest bands in the wavelength range from 6000 to 8000 Å are the TiOλ6158, λ6216, λ7053, and λ7589 γ-bands (Kirkpatrick et al. 1991; Valenti et al. 1998). Their relative strength and depth are different for the individual K- and M-type spectra. We therefore compared the position of the band heads of these TiO bands – in addition to the NaD lines – with the spectral features of the template spectrum of an elliptical galaxy in order to derive the redshifts of galaxies G6 and G16.
To this end, we scaled the TiO band heads as well as the NaD line in the galaxy spectra such that their amplitude matched the corresponding band head or line, respectively, in the template spectrum. This procedure resulted in four spectral sections, namely around NaDλ5892, TiOλ6158 and λ6216, λ7053, and TiOλ7589. The boundaries between the sections are given by the telluric O2 absorption band at 7590–7660 Å and a region at around 8370 Å (both in the observed frame) that is heavily contaminated by night-sky emission. In addition, we chose the boundary between NaDλ5892 on the one hand and TiOλ6158 and λ6216 on the other hand to be at 6000 Å. In contrast to G16, the amplitude scaling factors of the λ6158 and λ6216 band heads in G6 do not match. We therefore determined their scaling factors individually and combined both resulting spectra at 6178 Å. Figure 5 shows the composite spectra of G6 (green line) and G16 (red line) superimposed on the SDSS template spectrum (gray lines) of an elliptical galaxy. We derived a redshift of z = 0.165 ± .001 for G16 and a redshift of z = 0.161 ± .001 for G6 (Table 3).
Results from the spectroscopic observations.
Galaxy G2 shows strong Hα, [N II]λ6548, λ6584, and [S II]λ6717,λ6731 emission lines – and in addition the Ca II infrared triplet (8498, 8542, 8662 Å) in absorption – at a redshift of z = 0.0422 ± .0001 (see Fig. 6). It does not show as strong TiO bands as in the other two cases; the strongest band head is that of the TiOλ7053 band. This galaxy is discussed in more detail in Sect. 5.2.
The results from the spectroscopic observations are summarized in Table 3. The given R magnitudes were derived from the observed mean fluxes in the spectra at 6450–6550 Å. They have also been calculated in the STMAG system that is used by the Hubble Space Telescope photometry packages (Stone 1996).
4. Radio data analysis
The source 24P73 was observed with GMRT at 610 MHz and 325 MHz in 2008 and 2009. Total on-source time for the 610 MHz and 325 MHz observations was 7 h 42 min and 9 h 40 min, respectively. We calibrated and imaged the archival data using Source Peeling and Atmospheric Modeling (SPAM; Intema et al. 2009). The pipeline executes a semiautomated series of iterative flagging, calibration, and (most importantly) imaging, using a procedure that allows a direction-dependent calibration of the data. The data sets for different days were combined into a single one for imaging. The initial flux and bandpass calibrations for the 325 MHz and 610 MHz data sets were carried out using the standard flux calibrators 3C286 and 3C48, respectively.
Additionally, we measured the flux density of the source VLSS J2217.5+5943 in the snapshot image of the Very Large Array Low-Frequency Sky Survey Redux (VLSSr; Lane et al. 2014) and the cutout image of the TIFR GMRT Sky Survey Alternative Data Release (TGSS ADR; Intema et al. 2017). Moreover, we included the flux values reported in the 8C Revised Rees Survey 38-MHz Source Catalog (8C; Rees 1990; Hales et al. 1995) and the value obtained by Westerbork Synthesis Radio Telescope (WSRT) observations as reported by van Weeren et al. (2009). Finally, we analyzed Quick Look continuum images of the Very Large Array Sky Survey (VLASS; Lacy et al. 2020). We also determined the flux density for the compact source J221736.2+594407 (component V; see Sect. 5), where possible. The resulting radio spectra and spectral indices α (for Sν ∝ ν−α) are shown in Fig. 7.
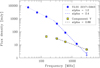 |
Fig. 7. Spectrum of VLSS J2217.5+5943, i.e., components II–IV (blue) and component V (dark yellow). Data are from the 8C catalog (38 MHz), VLSS (74 MHz), TGSS ADR (150 HMz), GMRT 325 MHz and 610 MHz, WSRT (1.4 GHz), and VLASS (3 GHz). The upper limit from VLASS corresponds to the 68 % confidence limit. |
5. The galaxy cluster in the field of VLSS J2217.5+5943
Green & Joncas (1994) presented a VLA L-band image at 1.5 GHz, where the radio source 24P73 is resolved into two distinct components, a brighter unresolved northern component and “faint, poorly defined emission extended over about an arcmin” that accounts for the bulk of the emission at 408 MHz. Figure 8 shows the part of the field from Fig. 1 that contains both the radio emission and the brightest galaxies. For the sake of clarity, we distinguish five radio components, which are marked by black ellipses and labeled I to V in Fig. 8. The radio phoenix VLSS J2217.5+5943 described by van Weeren et al. (2009) and van Weeren et al. (2011) consists of components II, III, and IV. Below, we briefly discuss the association of the radio components with galaxies. We start with components II–IV, which are of central importance to the present study.
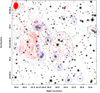 |
Fig. 8.
|

5.1. Components II, III, and IV
Our galaxy sample appears to be small. But this is again an expected consequence of the high foreground extinction in the innermost ZoA. The number density of bright galaxies is clearly higher than the mean value (Frith et al. 2003, see below). It can thus be assumed that our sample represents a cluster or group of galaxies. This interpretation is supported by the discovery of extended X-ray emission with Chandra (Mandal 2021) as well as by the mass estimation (see Sect. 5.4 below).
The majority of the galaxies in the sample, particularly the brighter ones, belong to an elongated structure that extends roughly from G1 in the SW to G19 and G20 at the NE end11. The brightest galaxies at each end are G6 and G16. Thus, it seems very likely that the concentration of galaxies seen in Fig. 8 is connected with G6 and G16, rather than with G2. We deduce, therefore, that the redshift of the cluster is z = 0.163 ± .003, corresponding to a luminosity distance of DL = 752 Mpc and an angular scale of 2.7 kpc per arcsec. The diameter of the region from which the galaxies were selected is thus ∼0.8 Mpc. Properties of the radio phoenix VLSS J2217.5+5943 derived with that redshift are given in Table 4.
Observed properties of VLSS J2217.5+5943.
The X-ray emission does not show a significant peak, and thus the dynamical state of the cluster is most likely unrelaxed (Mandal 2021). Based on the distribution of the brightest galaxies, we classify the cluster as Rood-Sastry type L, meaning three or more supergiant galaxies among the top ten brightest galaxies are evenly spaced along a line. Wen & Han (2013) calculated relaxation parameters of 2092 rich clusters and analyzed statistical correlations with other cluster properties. They found that clusters of type L – as well as types C, F, and I – tend to be less relaxed than clusters with an outstandingly bright type cD galaxy or with two supergiant galaxies with a small separation (type B).
We used the K luminosities to compute the luminosity-weighted center of the galaxies. The K luminosity, LK, of a galaxy is computed from its absolute magnitude, MK = K − DM − AK − kK, adopting MK, ⊙ = 3.27 (Vega), where K is the measured Petrosian K magnitude, DM = 5 log dL(Mpc) + 25 is the distance modulus, and AK and kK are the interstellar extinction and the k-correction in the K band. Evolution corrections are neglected here. Adopting AK = 0.31 E(B − V), E(B − V) = 1.80, and the k corrections from Chilingarian & Zolotukhin (2012)12, we derived the absolute magnitudes given in Table 1. The luminosity distance, dL, was computed under the assumption z = 0.163, with the exception of G2, for which we used z = 0.042. The resulting luminosity-weighted center at  (J2000), indicated by the x symbol in Fig. 8, is very close to both the bright galaxy G13 and the center of the diffuse X-ray emission detected by Mandal (2021). According to Table 1, G13 and G6 are the two brightest cluster galaxies. Using the method described in Sect. 2.4, we derived a corrected magnitude MK = −26.05 for G13, very similar to that of the brightest cluster galaxy NGC 1275 in the Perseus cluster.
The extended emission region from Green & Joncas (1994) can be subdivided into three different components, II, III, and IV, in the 610 MHz image (see Fig. 8). The largest angular scale of ∼100 arcsec, which includes the three components, corresponds to a (projected) largest linear size (LLS) of 270 kpc. Component IV is by far the brightest part at 620 MHz. It shows an irregular structure with several emission peaks. A separate faint peak is positionally coincident with the core of G13 and seems to indicate that this galaxy is active at some level. Remarkably, the other emission peaks are not associated with individual sources in the NIR (Fig. 8) or MIR (Fig. 9). The closest projected distance of an emission peak from the center of the galaxy distribution is Rproj = 68 kpc. The 1.4 GHz radio power and the relatively small values for the LLS and Rproj (Table 4) are in good agreement with the corresponding values for the other radio phoenices in the van Weeren et al. (2009) sample.
The spectral index between 325 and 610 MHz shows little variation across VLSS J2217.5+5943 (Fig. 10). The radio spectrum is strongly bent (see Fig. 7 and van Weeren et al. 2009), indicating that the acceleration of electrons to relativistic energies faded a significant amount of time ago. Assuming a field strength of about 5 μG in the emitting volume, we estimate that the electron acceleration faded 60 Myr ago. van Weeren et al. (2009) adopted an equipartition field strength of about 25 μG and estimated 30 Myr. The radio feature VLSS J2217.5+5943 may conceivably correspond to remnant lobes of a former active phase of one of the galaxies in the cluster (see, e.g., Brienza et al. 2017 for remnant radio galaxies from the LOFAR Lockman Hole field). However, the morphology of VLSS J2217.5+5943 is unusually distorted compared to other well-studied dying radio galaxies in galaxy clusters (Murgia et al. 2011). None of the galaxies we identified in the vicinity of VLSS J2217.5+5943 is a clear host galaxy (e.g., for symmetry reasons). Large velocities in the Intracluster-Medium (ICM) may have been displaced and may have reshaped the plasma lobes emitted by one of the galaxies. A current study on how ICM motions may advect the plasma lobes is available in Vazza et al. (2021). The spectral aging may have significantly diminished the luminosity of the source at 1.4 GHz. If the source once had a radio power, as expected from extrapolating from lower frequencies, the luminosity would be one order of magnitude higher than estimated in Table 4, which still results in a luminosity that is very typical for radio galaxies.
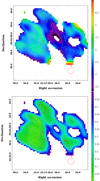 |
Fig. 10. Spectral index map (top) and spectral index error map (bottom) between 325 and 610 MHz with 325 MHz contours (white). |
Component III shows a nearly linear structure. The center of the radio emission, approximately halfway along the linear extension, seems to be associated with G14. It is thus tempting to speculate that G14 is a radio galaxy. Interestingly, G14 is very close to the bright galaxy G16, with a projected core distance of only 12 kpc at the redshift of the cluster. However, the spectral index map between 325 and 610 MHz (see Fig. 10) indicates that its spectrum is at least as steep as in component IV. Therefore, we reject the idea that the radio emission of component III is predominantly associated with current AGN activity in this part.
Component II appears to have an irregular structure of low surface brightness. With one exception, the subunits are not obviously associated with individual galaxies. The only exception is a faint and compact source at the southern border that seems to be positionally coincident with G9.
5.2. Component I: The brightest galaxy G2
A faint radio source is clearly visible close to the center of the bright galaxy G2. Our optical spectrum of G2 allowed us to measure the diagnostic line ratios [N II] 6548,6584/Hα and [S II] 6717,6731/Hα. Based on the standard demarcation lines in the BPT diagrams (named after “Baldwin, Phillips & Telervich”) (Kewley et al. 2001; Kauffmann et al. 2003), G2 is a LINER. Moreover, there might be an additional weak, broad Hα component, which would indicate that G2 is a LINER type 1 galaxy. G2 is the brightest and largest galaxy in the field. It can unquestionably be classified as a disk galaxy at a large inclination angle. The disk is traceable up to distance of 8–10 kpc from its center. With a luminosity distance of 184 Mpc, compared to 742 Mpc for G6 and 762 Mpc for G16, G2 is obviously in the foreground. In addition, its projected position is far from the centers of both the galaxy distribution (see below) and the diffuse X-ray emission.
Macri et al. (2019) recently detected either an isolated group or a small cluster with redshift of ∼12 000 km s−1 just outside of the innermost ZoA at l ∼ 100° and b ∼ −5°. Intriguingly, G2 at l = 104° and b = 2.4° has the same redshift (v = 12 600 km s−1) as this group, and is thus 25 Mpc away from it. The group from Macri et al. (2019) and G2 could thus belong together and form a hidden supercluster, whose diameter would be on the order of 25 Mpc. This corresponds to the size of the Local Supercluster. However, at present there has been no detection of galaxies in between G2 and the group from Macri et al. (2019) to further support this assumption.
5.3. Compact component V
In contrast to the other components, component V – the compact radio source J221736.2+594407 – has a typical AGN spectrum with  . At lower frequencies, the spectrum is flatter with
  (see also van Weeren et al. 2011, their Fig. 6), most likely due to synchrotron self-absorption.
On the UGPS image a very faint NIR counterpart is seen, but it is not listed in the UKIDSSDR11PLUS database. At the same position, the Spitzer images in the IRAC 1 and 2 bands show a brighter source (Fig. 11). The SMOG catalog provided by the NASA/IPAC Infrared Science Archive (IRSA) lists the star-like source SSTSMOGC G104.6467+02.4411 at this position. The source has the IRAC magnitudes [3.6] = 16.72 ± 0.08 and [4.5] = 16.09 ± 0.10 (Vega system) but is too faint to be measured in the other two IRAC bands. Adopting E(B − V) = 1.8 and the extinction law measured in the Spitzer IRAC bands (Indebetouw et al. 2005; Chapman et al. 2009), we find an extinction-corrected color index [3.6]–[4.5] (Vega) = 0.55 ± 0.17, which is necessary but not sufficient for classifying the source as an AGN (Stern et al. 2005; Donley et al. 2012). We assume that the compact radio component at J221736.2+594407 is most likely a background AGN that is not related to the galaxy cluster.
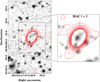 |
Fig. 11. Infrared counterpart of the compact radio source J221736.2+594407 (red contour lines) on the UGPS JHK image (left) and the IRAC 1+2 stack (right). Only the outer radio contours are plotted in order to show the NIR sources at the 610 MHz peak position (lowest contour at 3σ local background, followed by steps of 5σ). |
5.4. Total stellar light, stellar mass, and cluster mass
The summed luminosity of all galaxies, except G2, is ∼1.5 × 10¹² L⊙, where the unknown luminosity of G21 was simply set equal to that of G19. A more realistic estimate of the total luminosity of the cluster must in particular take the incompleteness of the galaxy selection and the possible contamination by foreground and background galaxies into account. We assume that the galaxy selection is complete for the brighter galaxies with K ≲ 16, corresponding to LK ≳ LK, min. We can then estimate the total stellar K-band luminosity by
 (1)
(1)
where LK, i(≳LK, min) is the luminosity of the galaxy i that is brighter than LK, min. The factor fc includes the contribution from the galaxies fainter than LK, min, fbg is the expected proportion of background galaxies13, and fP corrects for the fraction of light that is not covered by the Petrosian magnitudes of the galaxies.
The correction factor fc can be estimated if the galaxy luminosity function (LF) Φ(L) is known. For the Schechter LF (i.e., Φ(x) ∝ x α e−x ) with the two parameters L* and α, it turns out that
 (2)
(2)
where Γ is the gamma function and x = L/L*. For MK, min ≈ −23.5 and the parameters of the K-band LF for galaxies in low-z clusters from De Propris (2017), we find fc ≈ 2. The surface density of background galaxies was taken from the number counts of 2MASS Extended Source Catalog galaxies presented by Frith et al. (2003). Applied to our search field, we expect six galaxies brighter than the observed magnitude of K ∼ 16, which corresponds to fbg = 0.38. In UKIDSS, the Petrosian flux is measured within a circular aperture to two times the Petrosian radius (Dye et al. 2006). The fraction of the galaxy’s flux recovered by the Petrosian magnitudes amounts to ∼80% for the de Vaucouleurs profile (Blanton et al. 2001; Graham & Driver 2005). We adopted a mean correction factor of fg = 1.2. Therewith, the corrected total stellar luminosity amounts to LK ≈ 3.3 × 10¹² L⊙ within R = 400 kpc.
It is generally accepted that the K-band luminosity is a good proxy for the stellar mass. The mass in the stellar component of the cluster is given by  . The mean mass-to-luminosity ratio depends on the stellar populations in the galaxies. Here, we adopted
  from Graham & Scott (2013), which results in
  . The fraction of stars that were stripped from their host galaxies and feed the diffuse intracluster light was neglected. The uncertainty of this estimation is difficult to ascertain. Projection effects and the unknown cluster membership of the galaxies are the most problematic issues. Furthermore, the completeness correction fc depends on the parameters of the LF, which may significantly differ from the mean cluster LF. Observations over the past two decades have demonstrated that the stellar light and the stellar mass are useful proxies for the total halo mass, ℳh, of galaxy clusters or groups (e.g., Lin et al. 2003; Andreon 2012; Ziparo et al. 2016; Wechsler & Tinker 2018; Palmese et al. 2020). Based on the
  relation from Ziparo et al. (2016), we derive a total mass of
  within R = 400 kpc, which corresponds to a high density contrast, Δ = ρ(R)/ρc(z)≈3.5 × 103, where ρc(z) is the critical mass density of the Universe at the redshift of the cluster. Given that the stellar-to-total mass is radially constant on scales from about 150 kpc to 2.5 Mpc (Andreon 2015) and adopting the NFW density profile, we roughly estimate
  and R500 = 1.4 ± 0.5 Mpc. The large errors reflect the uncertainties of the NFW profile parameters and the
  relation. For comparison, the mean mass of the host clusters from the sample of 22 radio phoenices studied by Mandal (2021) is
  . The radio relic is thus clearly within R500, as was found for the other known phoenices (van Weeren et al. 2009).
6. Summary and conclusions
The radio source VLSS J2217.5+5943 (24P73) has been tentatively classified as a representative of the rare class of radio phoenices in galaxy clusters. Because of its position in the innermost ZoA, a cluster had not been proven with certainty until now. We exploited archival data from the UGPS in the NIR and from the SMOG in the MIR and selected a sample of 23 galaxies within a radius of 2.5 arcmin.
We carried out spectroscopic observations of three of the brightest galaxies in the sample. For that aim we took advantage of the red to far-red integral field spectrograph LRS2-R at the 10 m HET, which is a superb instrument for securing spectra of faint red galaxies in the high-extinction regions close to the Galactic plane. We were able to derive a redshift of z = 0.165 ± .001 for the galaxy (G16) that is spatially associated with VLSS J2217.5+5943. A second galaxy (G6) – just outside the radio emission region – is found to have a redshift of z = 0.161 ± .001. The spectra and morphology of both systems correspond to E-type galaxies. The third galaxy we observed (G2) – at a distance of 120 arcsec from G16 – has turned out to be a foreground galaxy with a redshift of z = 0.042. It is of LINER 1 type. All three galaxies are strongly reddened with a visual extinction of nearly 6 mag due to Galactic dust in the innermost ZoA.
The galaxies G6 and G16 belong to a chain of more than ten galaxies, eight of which are brighter than MK = −24. We suggest that the chain represents a galaxy cluster at z = 0.163 ± .003. A similar redshift was anticipated by van Weeren et al. (2011) but with a significant uncertainty. The cluster mass is roughly estimated at  . The radio source VLSS J2217.5+5943 borders on the main part of the galaxy chain. The presence of a galaxy cluster, as indicated by our observations, corroborates that the source VLSS J2217.5+5943 became distorted and possibly enhanced in luminosity by the ICM. The largest projected linear extension of the radio phoenix is ∼270 kpc. The projected distance from the assumed cluster center to the closest radio emission peak is 68 kpc. These properties are very similar to those of the other known radio phoenices. According to its spectrum and luminosity, the source could be a remnant radio galaxy that is severely distorted by ICM motions that are possibly induced by a cluster merger. The presence of a cluster would explain the complex morphology of the source. Our observations provide evidence that this is indeed the case.
Data provided by the NASA/IPAC Extragalactic Database (NED).
With a length of ∼0.5 Mpc it is roughly half the size of the chain of bright galaxies in the Perseus cluster.
For simplicity, we refer to both foreground and background galaxies as background galaxies in the following.
Acknowledgments
This work has been supported by the DFG grants KO857/33-1, KO857/35-1 and CH71/34-3. This paper is based on observations obtained with the Hobby-Eberly Telescope, which is a joint project of the University of Texas at Austin, the Pennsylvania State University, Ludwig-Maximilians-Universität München, and Georg-August-Universität Göttingen. The Low Resolution Spectrograph 2 (LRS2) was developed and funded by the University of Texas at Austin McDonald Observatory and Department of Astronomy and by Pennsylvania State University. We thank the Leibniz-Institut für Astrophysik Potsdam (AIP) and the Institut für Astrophysik Göttingen (IAG) for their contributions to the construction of the integral field units. This paper makes extensive use of the United Kingdom Infrared Telescope (UKIRT) Infrared Deep Sky Survey (UKIDSS). UKIRT is operated by the Joint Astronomy Centre on behalf of the Science and Technology Facilities Council of the U.K. This research made use of Montage. It is funded by the National Science Foundation under Grant Number ACI-1440620, and was previously funded by the National Aeronautics and Space Administration’s Earth Science Technology Office, Computation Technologies Project, under Cooperative Agreement Number NCC5-626 between NASA and the California Institute of Technology. This publication has also made use of data products from the VizieR catalogue access tool, CDS, Strasbourg, France and of data obtained from the NASA/IPAC Infrared Science Archive (IRSA), operated by the Jet Propulsion Laboratories/California Institute of Technology, founded by the National Aeronautic and Space Administration. In particular, This work is based in part on observations made with the Spitzer Space Telescope, which is operated by the Jet Propulsion Laboratory, California Institute of Technology under a contract with NASA. In addition, data from the Pan-STARRS1 Surveys (PS1) were used in this paper. The Pan-STARRS1 Surveys (PS1) and the PS1 public science archive have been made possible through contributions by the Institute for Astronomy, the University of Hawaii, the Pan-STARRS Project Office, the Max-Planck Society and its participating institutes, the Max Planck Institute for Astronomy, Heidelberg and the Max Planck Institute for Extraterrestrial Physics, Garching, The Johns Hopkins University, Durham University, the University of Edinburgh, the Queen’s University Belfast, the Harvard-Smithsonian Center for Astrophysics, the Las Cumbres Observatory Global Telescope Network Incorporated, the National Central University of Taiwan, the Space Telescope Science Institute, the National Aeronautics and Space Administration under Grant No. NNX08AR22G issued through the Planetary Science Division of the NASA Science Mission Directorate, the National Science Foundation Grant No. AST-1238877, the University of Maryland, Eotvos Lorand University (ELTE), the Los Alamos National Laboratory, and the Gordon and Betty Moore Foundation.
References
- Andreon, S. 2012, A&A, 548, A83 [NASA ADS] [CrossRef] [EDP Sciences] [Google Scholar]
- Andreon, S. 2015, A&A, 575, A108 [NASA ADS] [CrossRef] [EDP Sciences] [Google Scholar]
- Barentsen, G., Farnhill, H. J., Drew, J. E., et al. 2014, MNRAS, 444, 3230 [NASA ADS] [CrossRef] [Google Scholar]
- Bessell, M. S., Castelli, F., & Plez, B. 1998, A&A, 333, 231 [NASA ADS] [Google Scholar]
- Blanton, M. R., Dalcanton, J., Eisenstein, D., et al. 2001, AJ, 121, 2358 [NASA ADS] [CrossRef] [Google Scholar]
- Brienza, M., Godfrey, L., Morganti, R., et al. 2017, A&A, 606, A98 [NASA ADS] [CrossRef] [EDP Sciences] [Google Scholar]
- Carey, S., Ali, B., Berriman, B., et al. 2008, Spitzer Mapping of the Outer Galaxy (SMOG), Spitzer Proposal [Google Scholar]
- Casali, M., Adamson, A., Alves de Oliveira, C., et al. 2007, A&A, 467, 777 [NASA ADS] [CrossRef] [EDP Sciences] [Google Scholar]
- Chambers, K. C., Magnier, E. A., Metcalfe, N., et al. 2019, ArXiv e-prints [arXiv:1612.05560v4] [Google Scholar]
- Chapman, N. L., Mundy, L. G., Lai, S. P., & Evans, N. J. I. 2009, ApJ, 690, 496 [Google Scholar]
- Chilingarian, I. V., & Zolotukhin, I. Y. 2012, MNRAS, 419, 1727 [Google Scholar]
- Chonis, T. S., Hill, G. J., Lee, H., et al. 2016, in LRS2: design, assembly, testing, and commissioning of the second-generation low-resolution spectrograph for the Ho bby-Eberly Telescope, Society of Photo-Optical Instrumentation Engineers (SPIE) Cof. Ser., 9908, 99084C [Google Scholar]
- De Propris, R. 2017, MNRAS, 465, 4035 [Google Scholar]
- Donley, J. L., Koekemoer, A. M., Brusa, M., et al. 2012, ApJ, 748, 142 [Google Scholar]
- Dressler, A., Lynden-Bell, D., Burstein, D., et al. 1987, ApJ, 313, 42 [Google Scholar]
- Dye, S., Warren, S. J., Hambly, N. C., et al. 2006, MNRAS, 372, 1227 [Google Scholar]
- Fazio, G. G., Hora, J. L., Allen, L. E., et al. 2004, ApJS, 154, 10 [NASA ADS] [CrossRef] [Google Scholar]
- Flewelling, H. A., Magnier, E. A., Chambers, K. C., et al. 2020, ApJS, 251, 7 [NASA ADS] [CrossRef] [Google Scholar]
- Frith, W. J., Busswell, G. S., Fong, R., Metcalfe, N., & Shanks, T. 2003, MNRAS, 345, 1049 [Google Scholar]
- Giovanelli, R., & Haynes, M. P. 1982, AJ, 87, 1355 [Google Scholar]
- Graham, A. W., & Driver, S. P. 2005, PASA, 22, 118 [NASA ADS] [CrossRef] [Google Scholar]
- Graham, A. W., & Scott, N. 2013, ApJ, 764, 151 [Google Scholar]
- Green, D. A., & Joncas, G. 1994, A&AS, 104, 481 [NASA ADS] [Google Scholar]
- Green, D. A., Lacy, M., Bhatnagar, S., Gates, E. L., & Warner, P. J. 2004, MNRAS, 354, 1159 [Google Scholar]
- Hales, S. E. G., Waldram, E. M., Rees, N., & Warner, P. J. 1995, MNRAS, 274, 447 [NASA ADS] [CrossRef] [Google Scholar]
- Hambly, N. C., Collins, R. S., Cross, N. J. G., et al. 2008, MNRAS, 384, 637 [NASA ADS] [CrossRef] [Google Scholar]
- Hewett, P. C., Warren, S. J., Leggett, S. K., & Hodgkin, S. T. 2006, MNRAS, 367, 454 [NASA ADS] [CrossRef] [Google Scholar]
- Higgs, L. A., & Joncas, G. 1989, JRASC, 83, 313 [Google Scholar]
- Hill, G. J., Drory, N., Good, J. M., et al. 2018, Proc. SPIE, 10700, 107000P [Google Scholar]
- Indebetouw, R., Mathis, J. S., Babler, B. L., et al. 2005, ApJ, 619, 931 [NASA ADS] [CrossRef] [Google Scholar]
- Intema, H. T., van der Tol, S., Cotton, W. D., et al. 2009, A&A, 501, 1185 [NASA ADS] [CrossRef] [EDP Sciences] [Google Scholar]
- Intema, H. T., Jagannathan, P., Mooley, K. P., & Frail, D. A. 2017, A&A, 598, A78 [NASA ADS] [CrossRef] [EDP Sciences] [Google Scholar]
- Kauffmann, G., Heckman, T. M., Tremonti, C., et al. 2003, MNRAS, 346, 1055 [Google Scholar]
- Kewley, L. J., Dopita, M. A., Sutherland, R. S., Heisler, C. A., & Trevena, J. 2001, ApJ, 556, 121 [NASA ADS] [CrossRef] [Google Scholar]
- Kinney, A. L., Calzetti, D., Bohlin, R. C., et al. 1996, ApJ, 467, 38 [NASA ADS] [CrossRef] [Google Scholar]
- Kirkpatrick, J. D., Henry, T. J., & McCarthy, D. W., Jr. 1991, ApJS, 77, 417 [Google Scholar]
- Kocevski, D. D., Ebeling, H., Mullis, C. R., & Tully, R. B. 2007, ApJ, 662, 224 [Google Scholar]
- Kraan-Korteweg, R. C. 2005, Rev. Mod. Astron., 18, 48 [Google Scholar]
- Kraan-Korteweg, R. C., van Driel, W., Schröder, A. C., Ramatsoku, M., & Henning, P. A. 2018, MNRAS, 481, 1262 [CrossRef] [Google Scholar]
- Lacy, M., Baum, S. A., Chandler, C. J., et al. 2020, PASP, 132 [Google Scholar]
- Lambert, T. S., Kraan-Korteweg, R. C., Jarrett, T. H., & Macri, L. M. 2020, MNRAS, 497, 2954 [Google Scholar]
- Lane, W. M., Cotton, W. D., van Velzen, S., et al. 2014, MNRAS, 440, 327 [NASA ADS] [CrossRef] [Google Scholar]
- Lawrence, A., Warren, S. J., Almaini, O., et al. 2007, MNRAS, 379, 1599 [NASA ADS] [CrossRef] [MathSciNet] [Google Scholar]
- Lin, Y.-T., Mohr, J. J., & Stanford, S. A. 2003, ApJ, 591, 749 [NASA ADS] [CrossRef] [Google Scholar]
- Lucas, P. W., Hoare, M. G., Longmore, A., et al. 2008, MNRAS, 391, 136 [NASA ADS] [CrossRef] [Google Scholar]
- Macri, L. M., Kraan-Korteweg, R. C., Lambert, T., et al. 2019, ApJS, 245, 6 [Google Scholar]
- Mandal, S., van Weeren, R. J., Shimwell, T. W., et al. 2021, A&A, submitted [Google Scholar]
- Murgia, M., Parma, P., Mack, K. H., et al. 2011, A&A, 526, A148 [NASA ADS] [CrossRef] [EDP Sciences] [Google Scholar]
- Oke, J. B., & Gunn, J. E. 1983, ApJ, 266, 713 [NASA ADS] [CrossRef] [Google Scholar]
- Palmese, A., Annis, J., Burgad, J., et al. 2020, MNRAS, 493, 4591 [Google Scholar]
- Polletta, M., Tajer, M., Maraschi, L., et al. 2007, ApJ, 663, 81 [NASA ADS] [CrossRef] [Google Scholar]
- Rees, N. 1990, MNRAS, 244, 233 [NASA ADS] [Google Scholar]
- Schlafly, E. F., & Finkbeiner, D. P. 2011, ApJ, 737, 103 [NASA ADS] [CrossRef] [Google Scholar]
- Schröder, A. C., Flöer, L., Winkel, B., & Kerp, J. 2019a, MNRAS, 489, 2907 [Google Scholar]
- Schröder, A. C., van Driel, W., & Kraan-Korteweg, R. C. 2019b, MNRAS, 482, 5167 [Google Scholar]
- Skrutskie, M. F., Cutri, R. M., Stiening, R., et al. 2006, AJ, 131, 1163 [NASA ADS] [CrossRef] [Google Scholar]
- Soto, K. T., Lilly, S. J., Bacon, R., Richard, J., & Conseil, S. 2016, MNRAS, 458, 3210 [NASA ADS] [CrossRef] [Google Scholar]
- Stern, D., Eisenhardt, P., Gorjian, V., et al. 2005, ApJ, 631, 163 [NASA ADS] [CrossRef] [Google Scholar]
- Stone, R. P. S. 1996, ApJS, 107, 423 [NASA ADS] [CrossRef] [Google Scholar]
- Strauss, M. A., Weinberg, D. H., Lupton, R. H., et al. 2002, AJ, 124, 1810 [NASA ADS] [CrossRef] [Google Scholar]
- Valenti, J. A., Piskunov, N., & Johns-Krull, C. M. 1998, ApJ, 498, 851 [Google Scholar]
- van Weeren, R. J., Röttgering, H. J. A., & Brüggen, M. 2011, A&A, 527, A114 [NASA ADS] [CrossRef] [EDP Sciences] [Google Scholar]
- van Weeren, R. J., Röttgering, H. J. A., Brüggen, M., & Cohen, A. 2009, A&A, 508, 75 [NASA ADS] [CrossRef] [EDP Sciences] [Google Scholar]
- Vazza, F., Wittor, D., Brunetti, G., & Brüggen, M. 2021, A&A, submitted [arXiv:2102.04193] [Google Scholar]
- Warren, S. J., Cross, N. J. G., Dye, S., et al. 2007, ArXiv e-prints [arXiv:astro-ph/0703037] [Google Scholar]
- Wechsler, R. H., & Tinker, J. L. 2018, ARA&A, 56, 435 [NASA ADS] [CrossRef] [Google Scholar]
- Wen, Z. L., & Han, J. L. 2013, MNRAS, 436, 275 [NASA ADS] [CrossRef] [Google Scholar]
- Werner, M. W., Roellig, T. L., Low, F. J., et al. 2004, ApJS, 154, 1 [NASA ADS] [CrossRef] [Google Scholar]
- Ziparo, F., Smith, G. P., Mulroy, S. L., et al. 2016, A&A, 592, A9 [NASA ADS] [CrossRef] [EDP Sciences] [Google Scholar]
All Tables
Positions, observed Petrosian K magnitudes, J − K colors, and absolute K magnitudes for the 23 selected galaxies.
All Figures
|
Fig. 1. RGB composite of the central 5′×5′ field around the position of the radio source 24P73 ( |
| In the text | |
|
Fig. 2. Morphology-color diagram for 658 UKIDSSDR11PLUS sources with J < 19.5 and K < 19.5 in the 24 square arcmin field around VLSS J2217.5+5943. The color index J − K is computed from the Petrosian magnitudes. Black and red symbols indicate sources classified as star-like or as galaxies, respectively. The dashed lines mark the selection area for the galaxies in the present study. |
| In the text | |
|
Fig. 3. Observed SED of G13 (black squares) based on corrected aperture magnitudes from Pan-STARRS rzy, UKIDSS JHK, and the four Spitzer IRAC bands corrected for Galactic interstellar extinction with E(B − V) = 2. The formal error bars for the photometric uncertainties are smaller than the symbol size. For comparison, the redshifted template spectrum of a 13 Gyr old E galaxy from Polletta et al. (2007) is overplotted for z = 0.0 − 0.90 in steps of 0.15 (colors). |
| In the text | |
|
Fig. 4. Smoothed LRS2 spectra of the galaxies G2 (black), G6 (green), and G16 (red). |
| In the text | |
|
Fig. 5. Red to far-red spectra of galaxies G16 (red) and G6 (green) and of an elliptical template spectrum (gray) from 5800 to 7800 Å (rest frame). The NaD absorption and the band heads of TiO at λ6158 (1), λ6216 (2), λ7053 (3), and λ7589 (4) are marked. The region around the [N II] and Hα emission complex of the template galaxy is shaded in gray because it coincides with the strong telluric A-band (7590–7660 Å) in the observed frame. A region around 7200 Å corresponding to roughly 8370 Å in the observed frame, which is close to the wavelength of the dichroic filter transition between the two channels and is also contaminated by night-sky emission lines, is also shaded in gray. |
| In the text | |
|
Fig. 6. Sections around the Hα region and the TiOλ7053 band head (3), as well as around the Ca II infrared triplet of G2. |
| In the text | |
|
Fig. 7. Spectrum of VLSS J2217.5+5943, i.e., components II–IV (blue) and component V (dark yellow). Data are from the 8C catalog (38 MHz), VLSS (74 MHz), TGSS ADR (150 HMz), GMRT 325 MHz and 610 MHz, WSRT (1.4 GHz), and VLASS (3 GHz). The upper limit from VLASS corresponds to the 68 % confidence limit. |
| In the text | |
|
Fig. 8.
|
| In the text | |
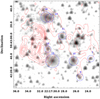 |
Fig. 9. 610 MHz contours (as in Fig. 8) plotted over the IRAC I1+I2 stacked image. |
| In the text | |
|
Fig. 10. Spectral index map (top) and spectral index error map (bottom) between 325 and 610 MHz with 325 MHz contours (white). |
| In the text | |
|
Fig. 11. Infrared counterpart of the compact radio source J221736.2+594407 (red contour lines) on the UGPS JHK image (left) and the IRAC 1+2 stack (right). Only the outer radio contours are plotted in order to show the NIR sources at the 610 MHz peak position (lowest contour at 3σ local background, followed by steps of 5σ). |
| In the text | |
Current usage metrics show cumulative count of Article Views (full-text article views including HTML views, PDF and ePub downloads, according to the available data) and Abstracts Views on Vision4Press platform.
Data correspond to usage on the plateform after 2015. The current usage metrics is available 48-96 hours after online publication and is updated daily on week days.
Initial download of the metrics may take a while.