Fig. 2.
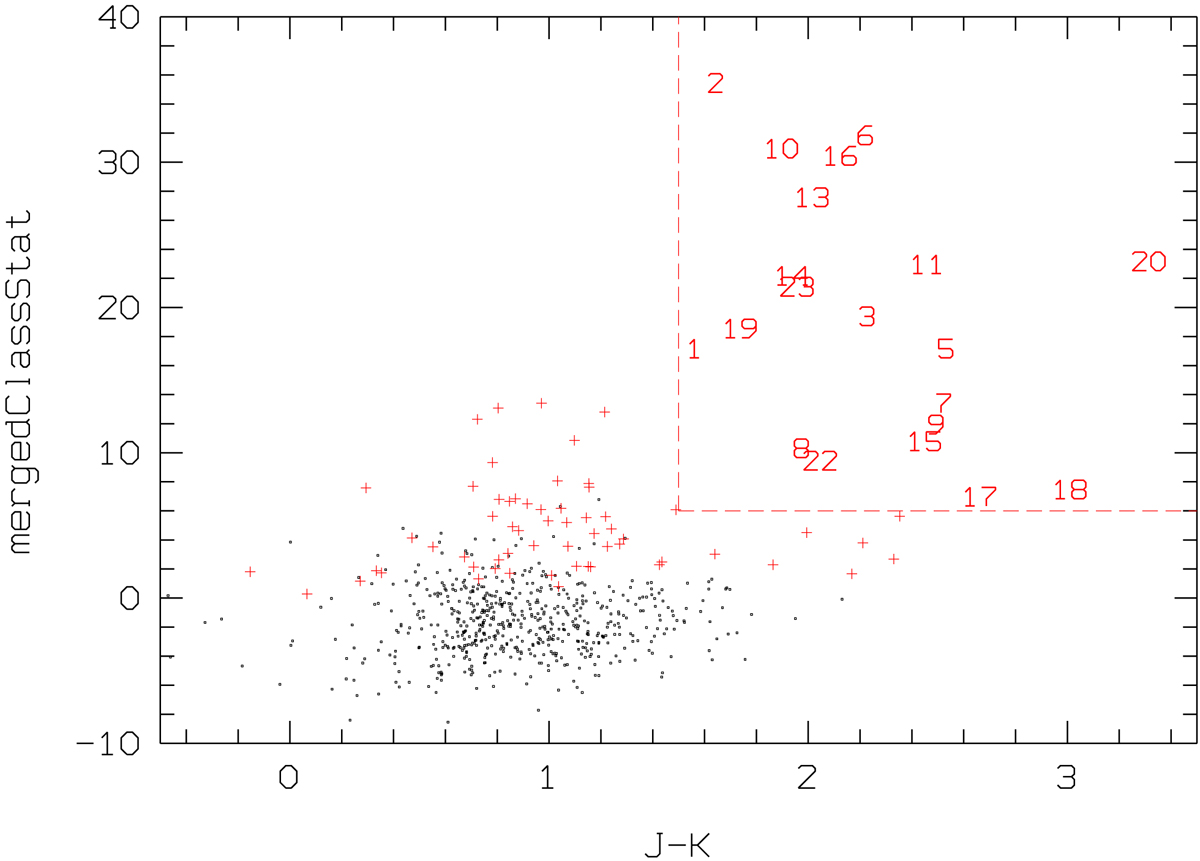
Morphology-color diagram for 658 UKIDSSDR11PLUS sources with J < 19.5 and K < 19.5 in the 24 square arcmin field around VLSS J2217.5+5943. The color index J − K is computed from the Petrosian magnitudes. Black and red symbols indicate sources classified as star-like or as galaxies, respectively. The dashed lines mark the selection area for the galaxies in the present study.
Current usage metrics show cumulative count of Article Views (full-text article views including HTML views, PDF and ePub downloads, according to the available data) and Abstracts Views on Vision4Press platform.
Data correspond to usage on the plateform after 2015. The current usage metrics is available 48-96 hours after online publication and is updated daily on week days.
Initial download of the metrics may take a while.