Fig. 8.
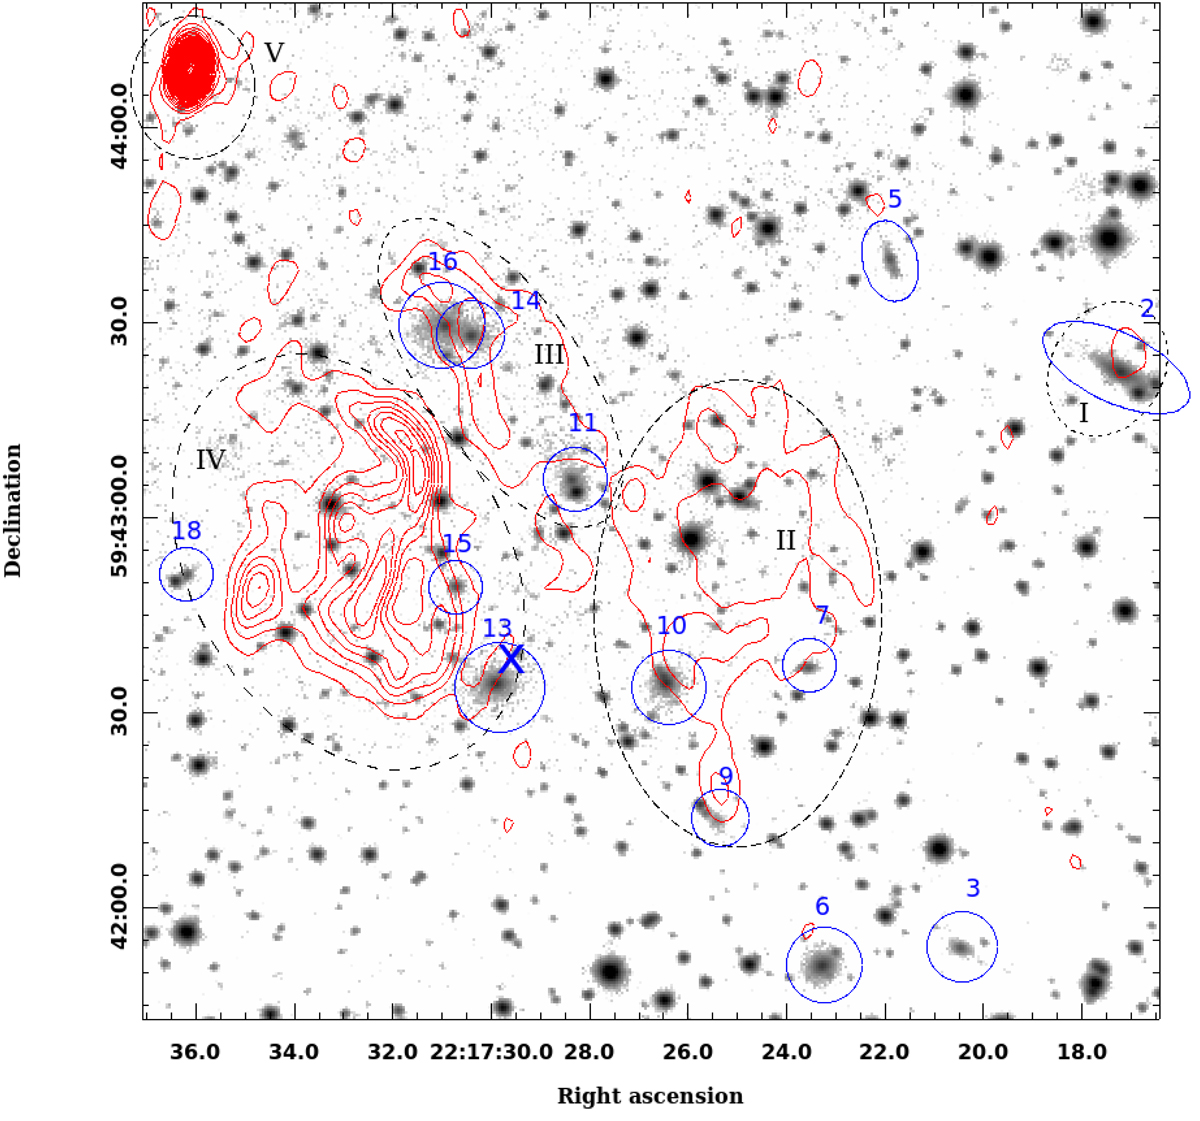
![]() field containing both the radio source 24P73 and the central part of the galaxy concentration with the brightest galaxies, G2, G6, G13, and G16. Galaxies are indicated by their blue color. The inverted grayscale background image is the stack of the J-, H-, and K-band images from UGPS. The red curves are the contour lines of the GMRT 610 MHz radio map (lowest level at 3σ, all others in steps of 5σ with σ = 55 μJy). Dashed black ellipses mark the five radio components, labeled with Roman numerals. The luminosity-weighted center of the projected galaxy distribution, excluding G2, is indicated by the blue x symbol.
field containing both the radio source 24P73 and the central part of the galaxy concentration with the brightest galaxies, G2, G6, G13, and G16. Galaxies are indicated by their blue color. The inverted grayscale background image is the stack of the J-, H-, and K-band images from UGPS. The red curves are the contour lines of the GMRT 610 MHz radio map (lowest level at 3σ, all others in steps of 5σ with σ = 55 μJy). Dashed black ellipses mark the five radio components, labeled with Roman numerals. The luminosity-weighted center of the projected galaxy distribution, excluding G2, is indicated by the blue x symbol.
Current usage metrics show cumulative count of Article Views (full-text article views including HTML views, PDF and ePub downloads, according to the available data) and Abstracts Views on Vision4Press platform.
Data correspond to usage on the plateform after 2015. The current usage metrics is available 48-96 hours after online publication and is updated daily on week days.
Initial download of the metrics may take a while.