Free Access
Fig. 6
Download original image
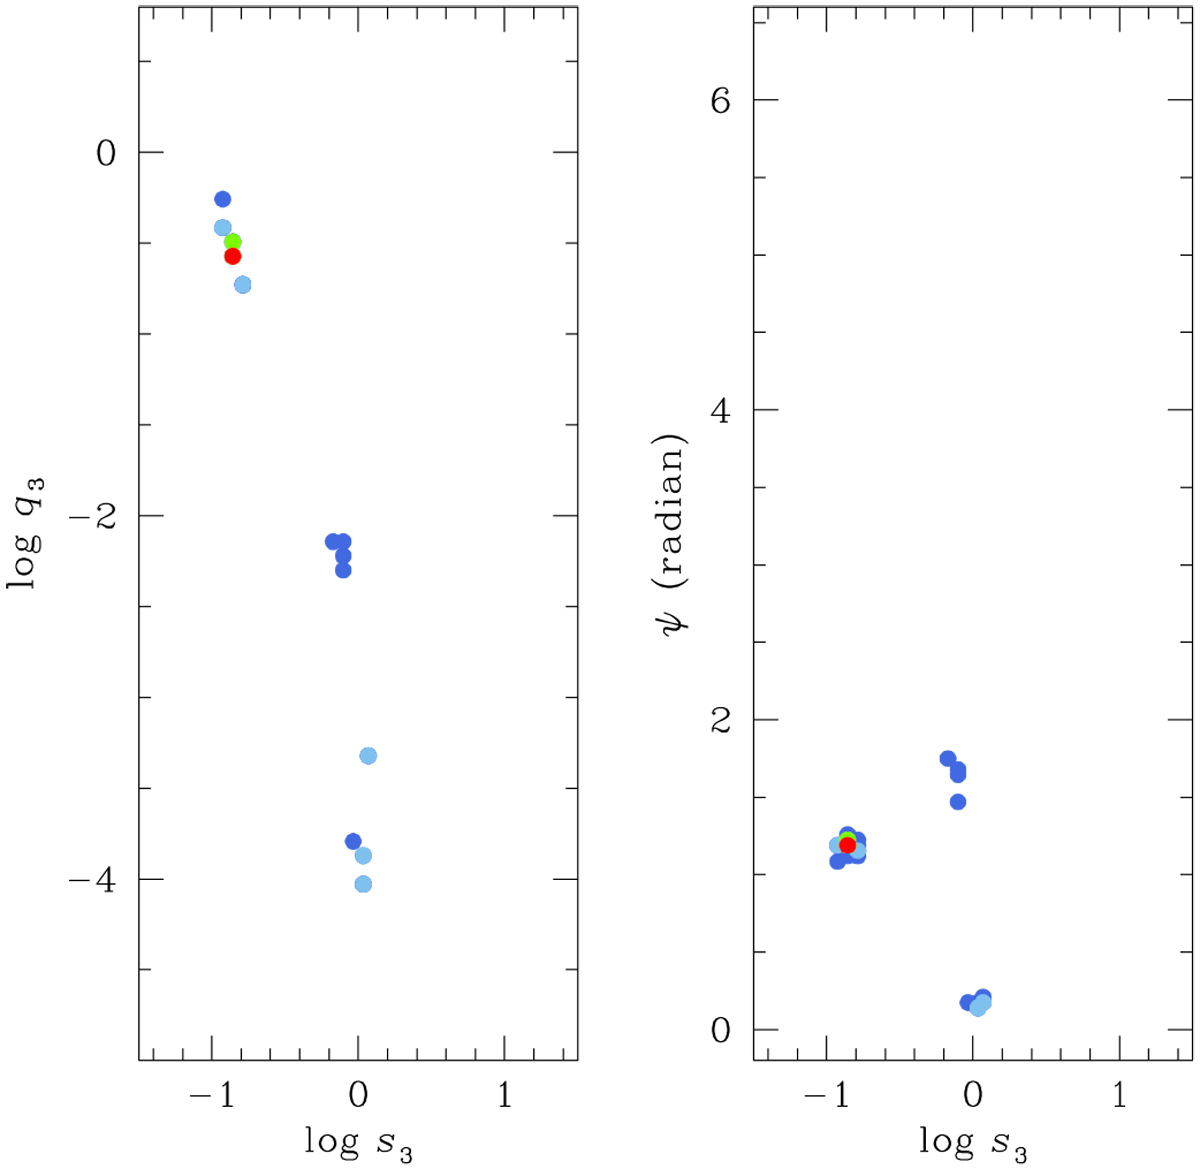
Δ χ2 maps in the logs3– logq3 (left panel) and log s3–ψ (right panel) planes obtained from the 3L1S grid search. The color coding is same as that in Fig. 3, except that n = 1.
Current usage metrics show cumulative count of Article Views (full-text article views including HTML views, PDF and ePub downloads, according to the available data) and Abstracts Views on Vision4Press platform.
Data correspond to usage on the plateform after 2015. The current usage metrics is available 48-96 hours after online publication and is updated daily on week days.
Initial download of the metrics may take a while.