Fig. 12
Download original image
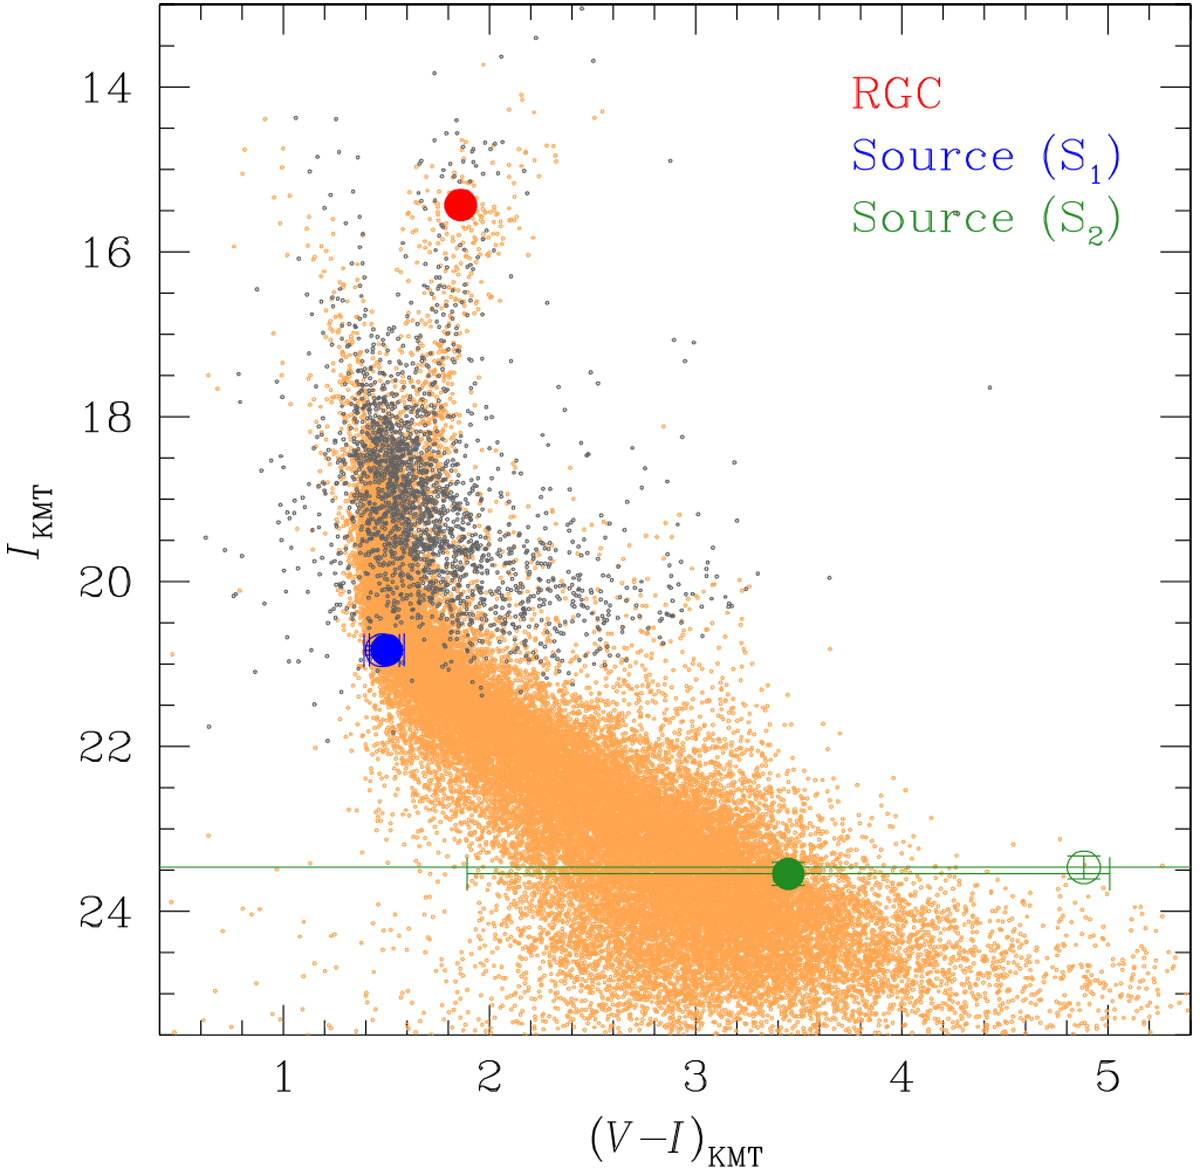
Locations of the primary (S1) and secondary (S2) source stars in the instrumental color-magnitude diagram (CMD). The pair of the filled blue and green dots denote the positions of S1 and S2 based on the wide 2L2S solution, and the pair of the empty dots indicate the positions based on the close 2L2S solution. The red filled dot denotes the centroid of red giant clump (RGC). The HST CMD (brown dots) is presented to show the source locations in the main-sequence branch.
Current usage metrics show cumulative count of Article Views (full-text article views including HTML views, PDF and ePub downloads, according to the available data) and Abstracts Views on Vision4Press platform.
Data correspond to usage on the plateform after 2015. The current usage metrics is available 48-96 hours after online publication and is updated daily on week days.
Initial download of the metrics may take a while.