Fig. 9.
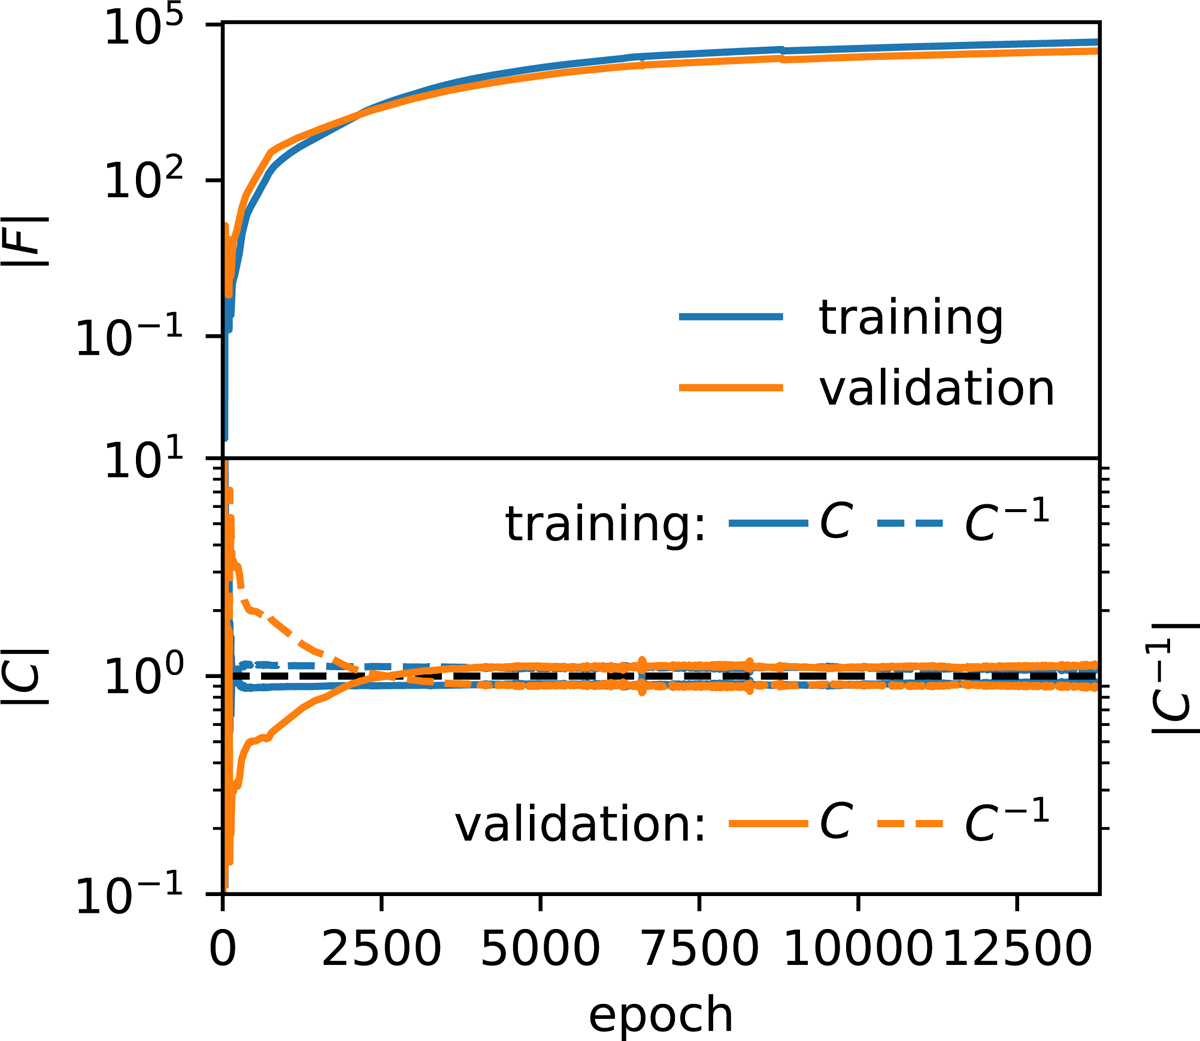
Top panel: evolution of the determinant of the Fisher information matrix during almost 14 000 epochs. The blue curve represents the information extracted from the training set, and the orange curve the information from the validation set. The determinant of the Fisher information is maximized on the training set and is comparable to the determinant of the Fisher information calculated with the validation set. This confirms that the two sets are representative samples. The training is stopped when the Fisher information of the validation set becomes relatively constant. Bottom panel: evolution of the determinants of the covariance matrix (solid line) and of the inverse of the covariance matrix (dashed line) for the training set (blue) and for the validation set (orange). The values quickly become constant, which shows that the network suppresses the parameter dependence of the covariance. Because the correlation between the parameters is strong, the covariance matrix cannot exactly diagonalize to the identity matrix, but the fact that it is constant shows that the parameter dependence is weak, which is the only requirement for the IMNN.
Current usage metrics show cumulative count of Article Views (full-text article views including HTML views, PDF and ePub downloads, according to the available data) and Abstracts Views on Vision4Press platform.
Data correspond to usage on the plateform after 2015. The current usage metrics is available 48-96 hours after online publication and is updated daily on week days.
Initial download of the metrics may take a while.