Fig. 8.
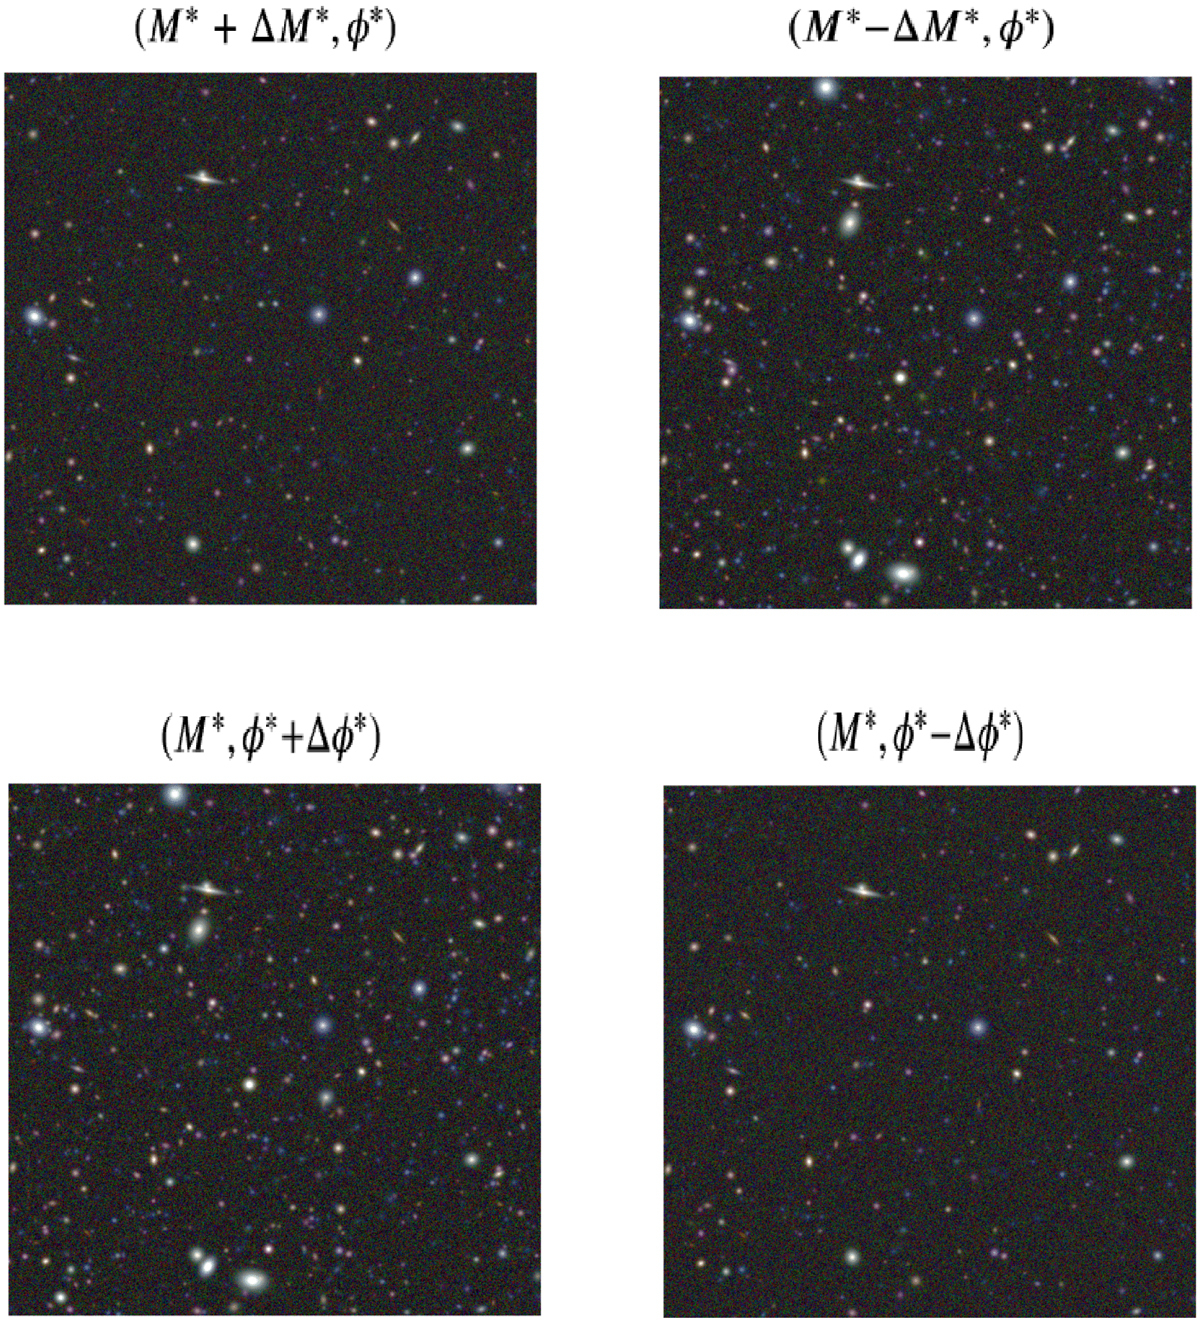
Color images (g′, r′, i′ filters) showing the effect of the perturbed values from fiducial for each parameter, as listed in Eq. (29). For each subplot we only added or removed the offset for one parameter listed in Eq. (29) and kept the other at its fiducial value. Decreasing the value of M* (top right) increases the number of galaxies. Decreasing the value of log10(ϕ*) decreases the number of galaxies. This shows that these two parameters are highly correlated.
Current usage metrics show cumulative count of Article Views (full-text article views including HTML views, PDF and ePub downloads, according to the available data) and Abstracts Views on Vision4Press platform.
Data correspond to usage on the plateform after 2015. The current usage metrics is available 48-96 hours after online publication and is updated daily on week days.
Initial download of the metrics may take a while.