Fig. 7.
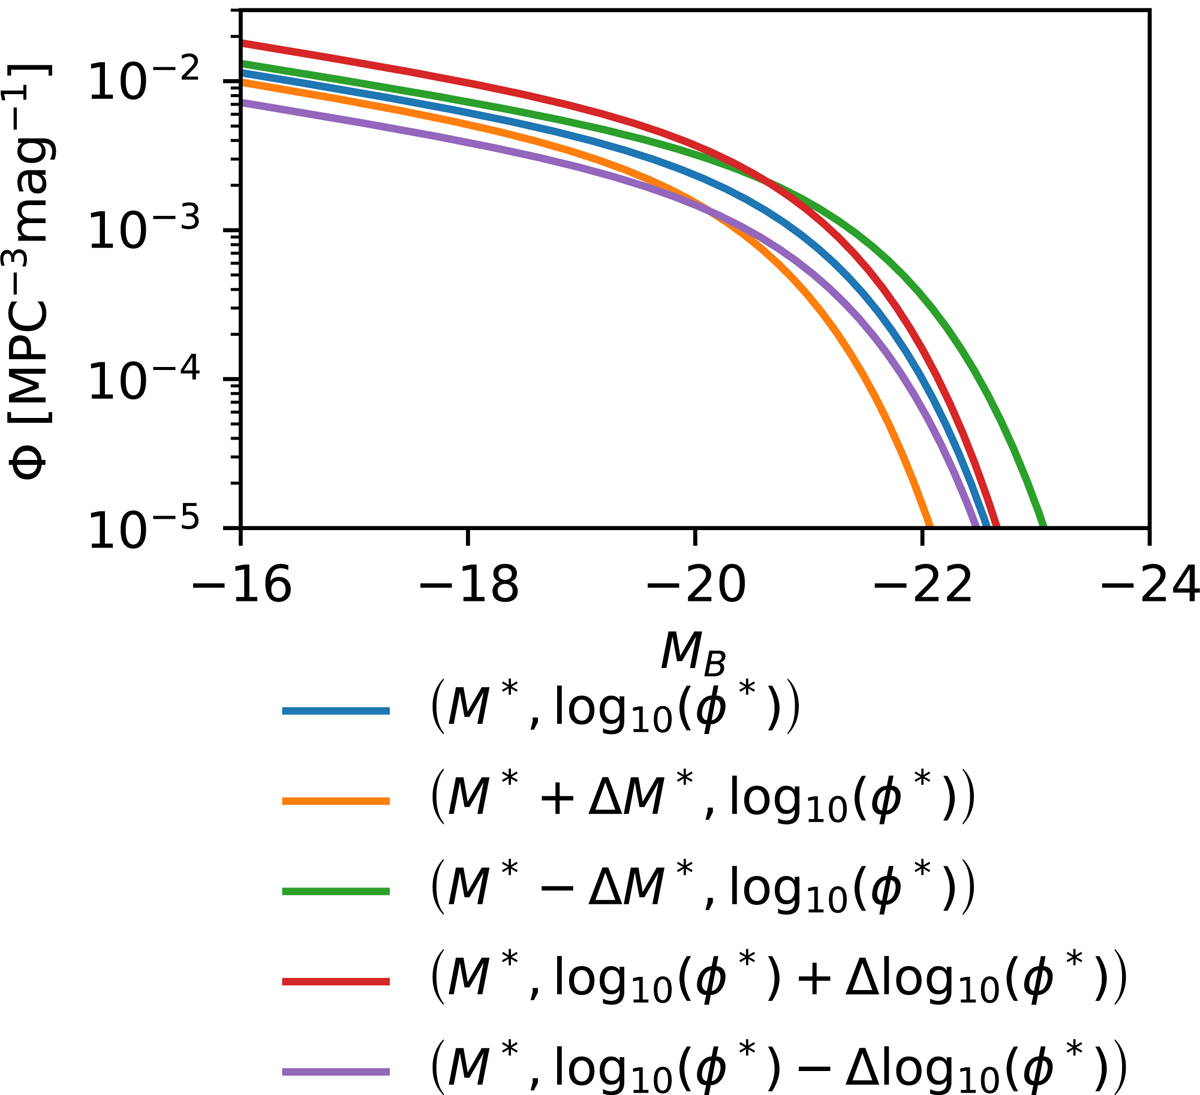
Theoretical luminosity functions of the spiral population with the perturbed values of the parameters used to train the network. The parameters used for each curve are listed in Eq. (29). The explicit features in the data, generated from these functions, provide the differences that the IMNN will become sensitive to when training, therefore mapping the effect of log10(ϕ*) and M* to informative summaries.
Current usage metrics show cumulative count of Article Views (full-text article views including HTML views, PDF and ePub downloads, according to the available data) and Abstracts Views on Vision4Press platform.
Data correspond to usage on the plateform after 2015. The current usage metrics is available 48-96 hours after online publication and is updated daily on week days.
Initial download of the metrics may take a while.