Fig. 3.
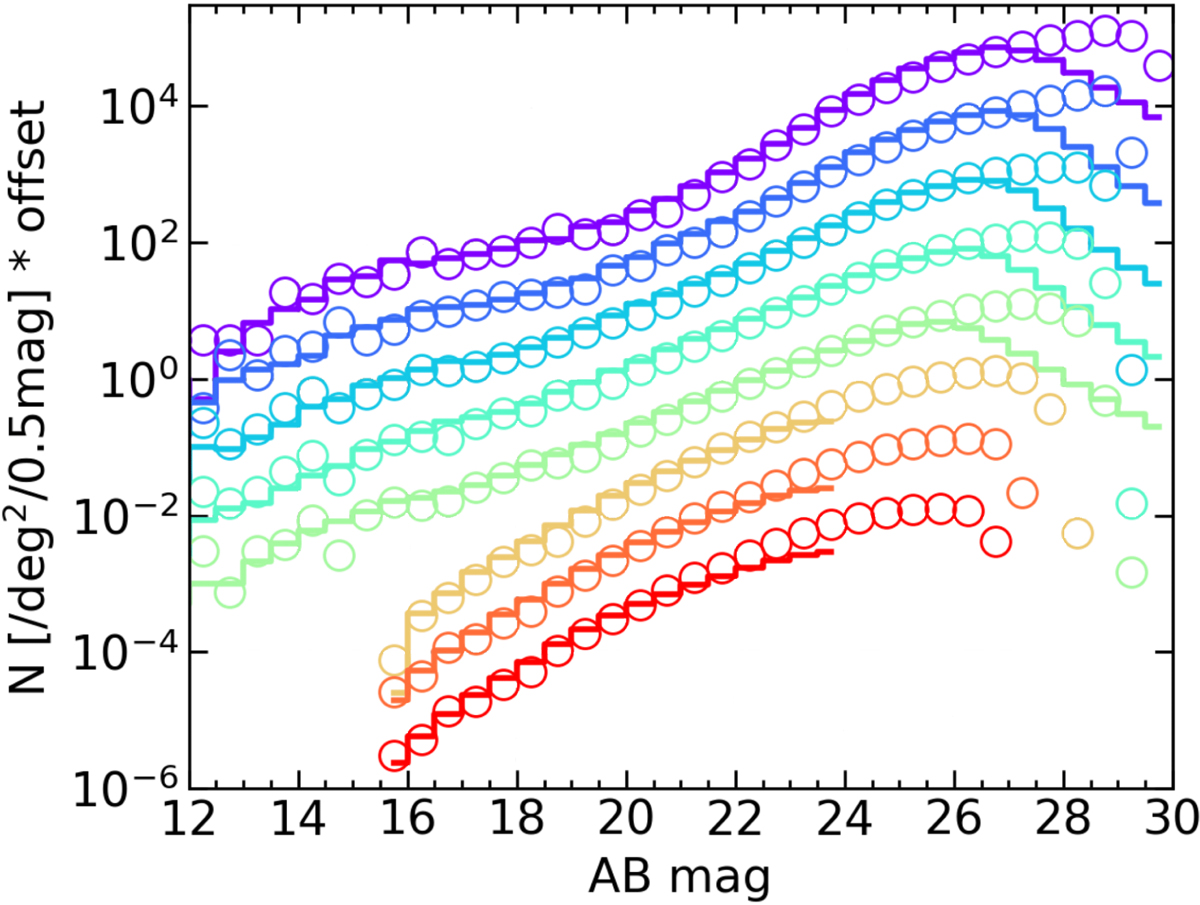
Differential source counts in u′, g′, r′, i′, z′, J, H, Ks (from top to bottom). Histograms show CFHTLS observations: star+galaxy counts built from u′, g′, r′, i′, z′ source catalogs from MegaPrime D1+D2 (Hudelot et al. 2012), and J, H, Ks galaxy counts taken from WIRCam D1+D2+D3+D4 (Bielby et al. 2012). Our fiducial model is shown as empty circles (without stars for near-IR bands, like the observations). For clarity, the counts in each band are regularly offset vertically downward by 1 dex from u′ to Ks. This graph shows that the magnitudes of the galaxies in the forward model agree well with the observations down to their completeness limits in all eight photometric bands.
Current usage metrics show cumulative count of Article Views (full-text article views including HTML views, PDF and ePub downloads, according to the available data) and Abstracts Views on Vision4Press platform.
Data correspond to usage on the plateform after 2015. The current usage metrics is available 48-96 hours after online publication and is updated daily on week days.
Initial download of the metrics may take a while.