Fig. 2.
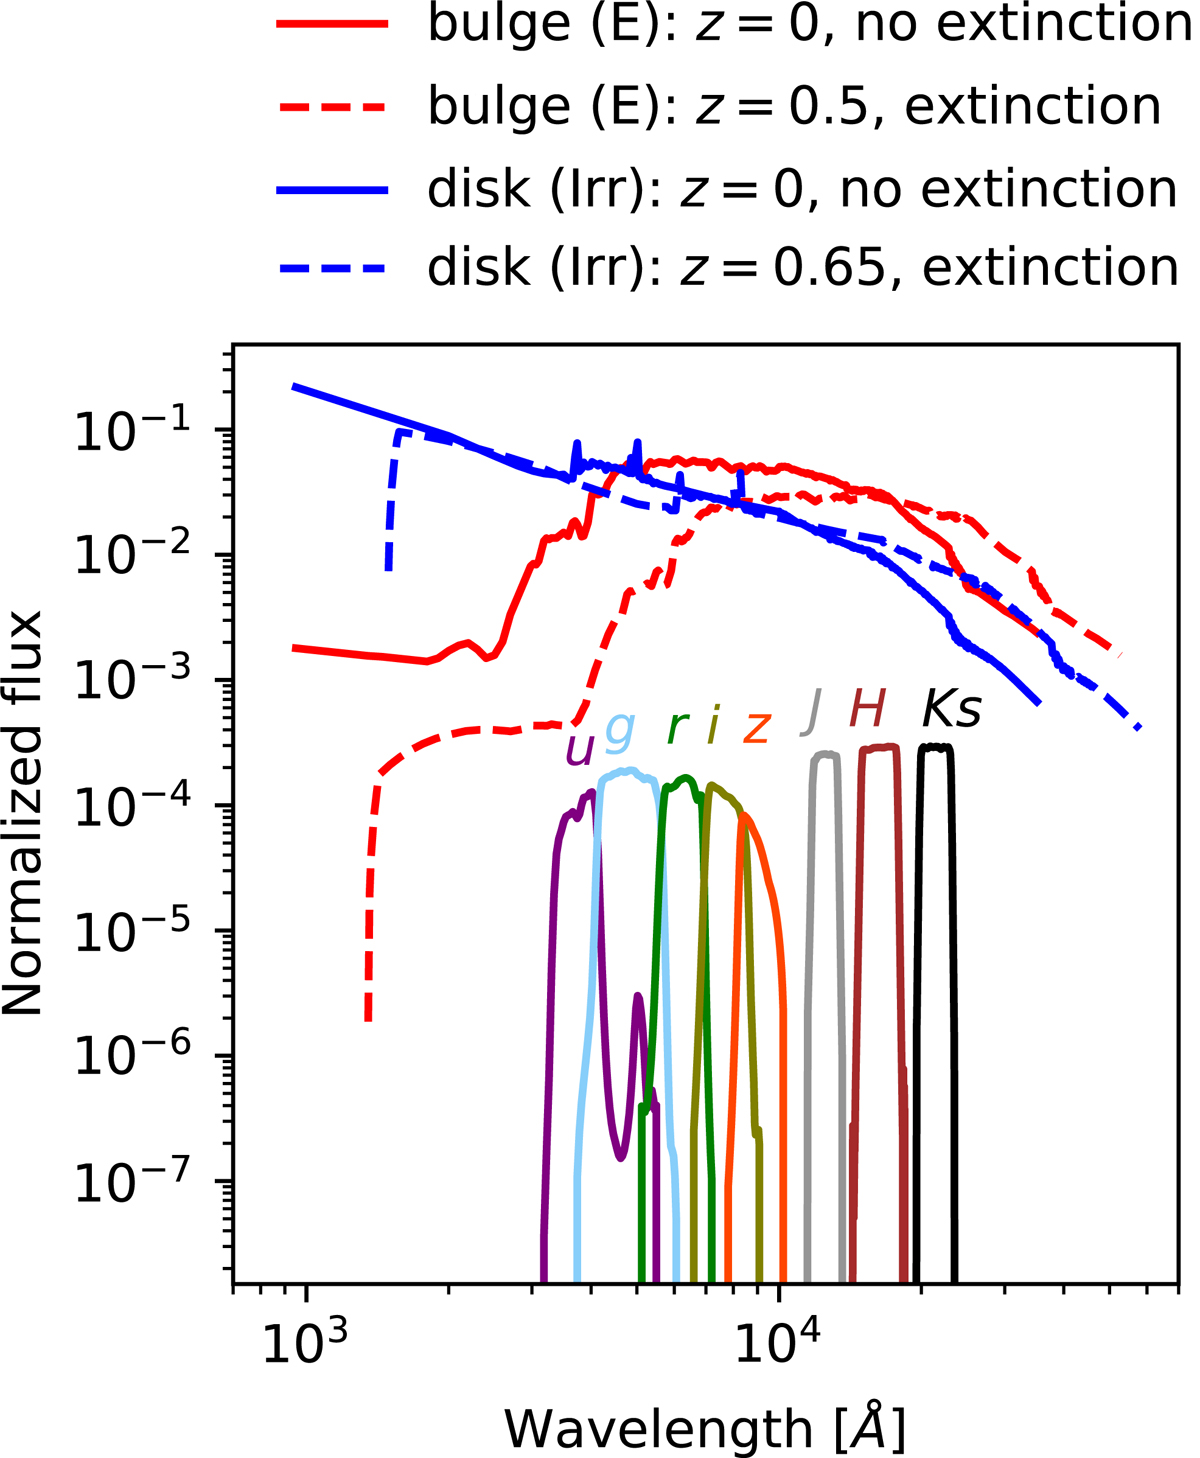
Example of the evolution of the bulge and disk SEDs from far-UV to near-IR. The plain red curve shows the generic E template SED of an elliptical galaxy of Coleman et al. (1980) at redshift z = 0 and without extinction. The dashed red curve shows the same SED at redshift z = 0.5 and with extinction (where ω = 1.68 and i = 45°, see Sect. 2.6). The plain blue curve shows the generic Irr template SED of Coleman et al. (1980) used here for the disk modeling of spirals at redshift z = 0 and without extinction. The dashed blue curve shows the same SED at redshift z = 0.65 and with extinction (where ω = 1.68 and i = 45°). This shows that even though these SEDs do not evolve explicitly, the evolution of the type-dependent luminosity functions and the different extinction effects implicitly allow for an SED evolution of individual galaxies. The plain curves are normalized so that the integral of the template SED multiplied by the SED of the reference SDSS g′ band equals 1. The eight filters used in this paper (u′, g′, r′, i′, z′, J, H, Ks) are shown at the bottom, and their responses are multiplied by a factor 0.0003.
Current usage metrics show cumulative count of Article Views (full-text article views including HTML views, PDF and ePub downloads, according to the available data) and Abstracts Views on Vision4Press platform.
Data correspond to usage on the plateform after 2015. The current usage metrics is available 48-96 hours after online publication and is updated daily on week days.
Initial download of the metrics may take a while.