Fig. 18.
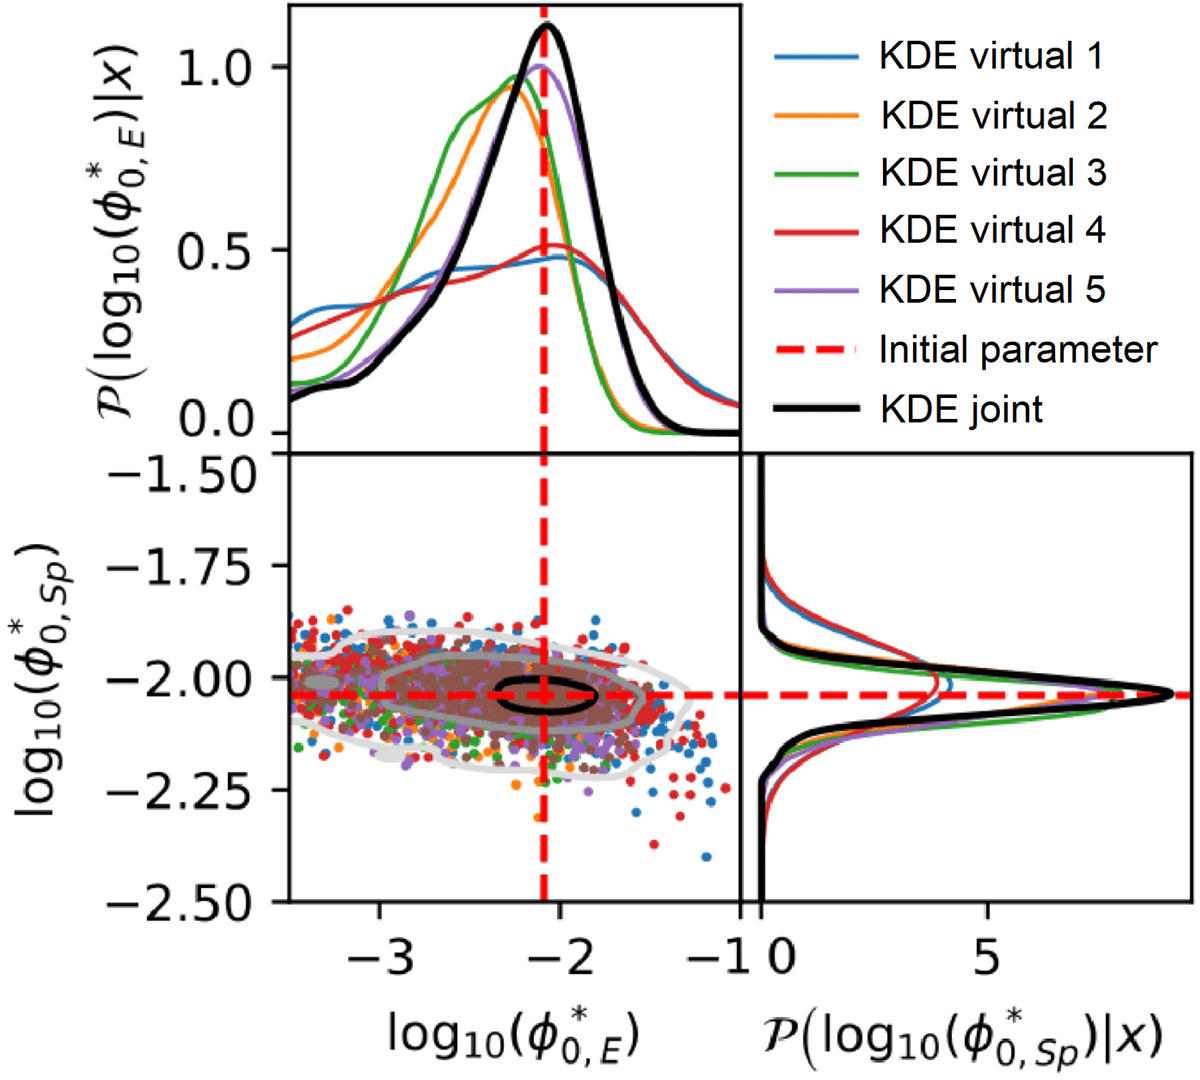
Posterior distributions of the two parameters log10(![]() ) and log10(
) and log10(![]() ) for the five images of virtual data (with different colors from blue to purple) and for the joint-PMC (black) described in Sect. 6.6. The 68%, 95%, and 99% contours of the joint-PMC are plotted in black, gray, and light gray, respectively, in the bottom left panel. The parameters used to generate the virtual data are indicated with dashed red lines. The five individual 1D posteriors for each image peak in the same region of parameter values, which indicates that the most likely parameters are consistent among the five images. The deviation between the different posteriors arises from the fact that these fields are stochastically sampled from a random process and so statistical differences exist in the data. The joint posterior is tighter and shows how likely the parameters would be if we considered the five images simultaneously.
) for the five images of virtual data (with different colors from blue to purple) and for the joint-PMC (black) described in Sect. 6.6. The 68%, 95%, and 99% contours of the joint-PMC are plotted in black, gray, and light gray, respectively, in the bottom left panel. The parameters used to generate the virtual data are indicated with dashed red lines. The five individual 1D posteriors for each image peak in the same region of parameter values, which indicates that the most likely parameters are consistent among the five images. The deviation between the different posteriors arises from the fact that these fields are stochastically sampled from a random process and so statistical differences exist in the data. The joint posterior is tighter and shows how likely the parameters would be if we considered the five images simultaneously.
Current usage metrics show cumulative count of Article Views (full-text article views including HTML views, PDF and ePub downloads, according to the available data) and Abstracts Views on Vision4Press platform.
Data correspond to usage on the plateform after 2015. The current usage metrics is available 48-96 hours after online publication and is updated daily on week days.
Initial download of the metrics may take a while.