Fig. 17.
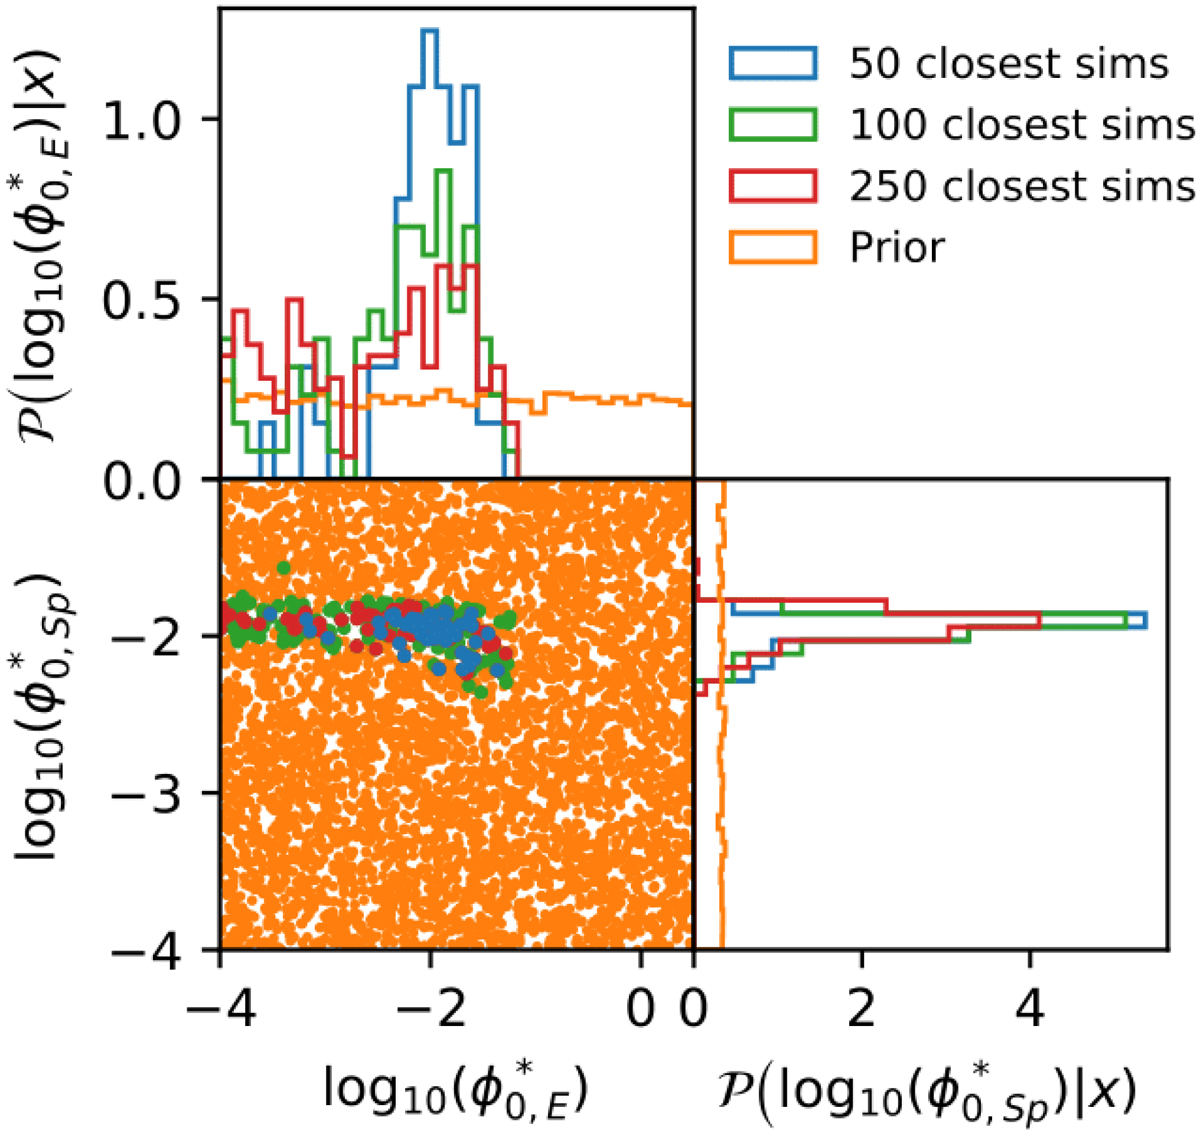
Results of the ABC procedure. Bottom left panel: parameter values corresponding to 5000 simulations (dots) drawn from our random uniform prior (orange) of Eq. (33). The colored points are those with a small distance ρ (Eq. (A.3)) to the observed data (frame “b” of Fig. 16 from the CFHTLS D1 Deep field): the 50 closest points are shown in blue, the 100 closest points are shown in green, and the 250 closest points are shown in red. Top left and bottom right: marginalized distributions of the distance selections in the bottom left panel. The points with the smallest distances appear to be around ![]() .
.
Current usage metrics show cumulative count of Article Views (full-text article views including HTML views, PDF and ePub downloads, according to the available data) and Abstracts Views on Vision4Press platform.
Data correspond to usage on the plateform after 2015. The current usage metrics is available 48-96 hours after online publication and is updated daily on week days.
Initial download of the metrics may take a while.