Fig. 14.
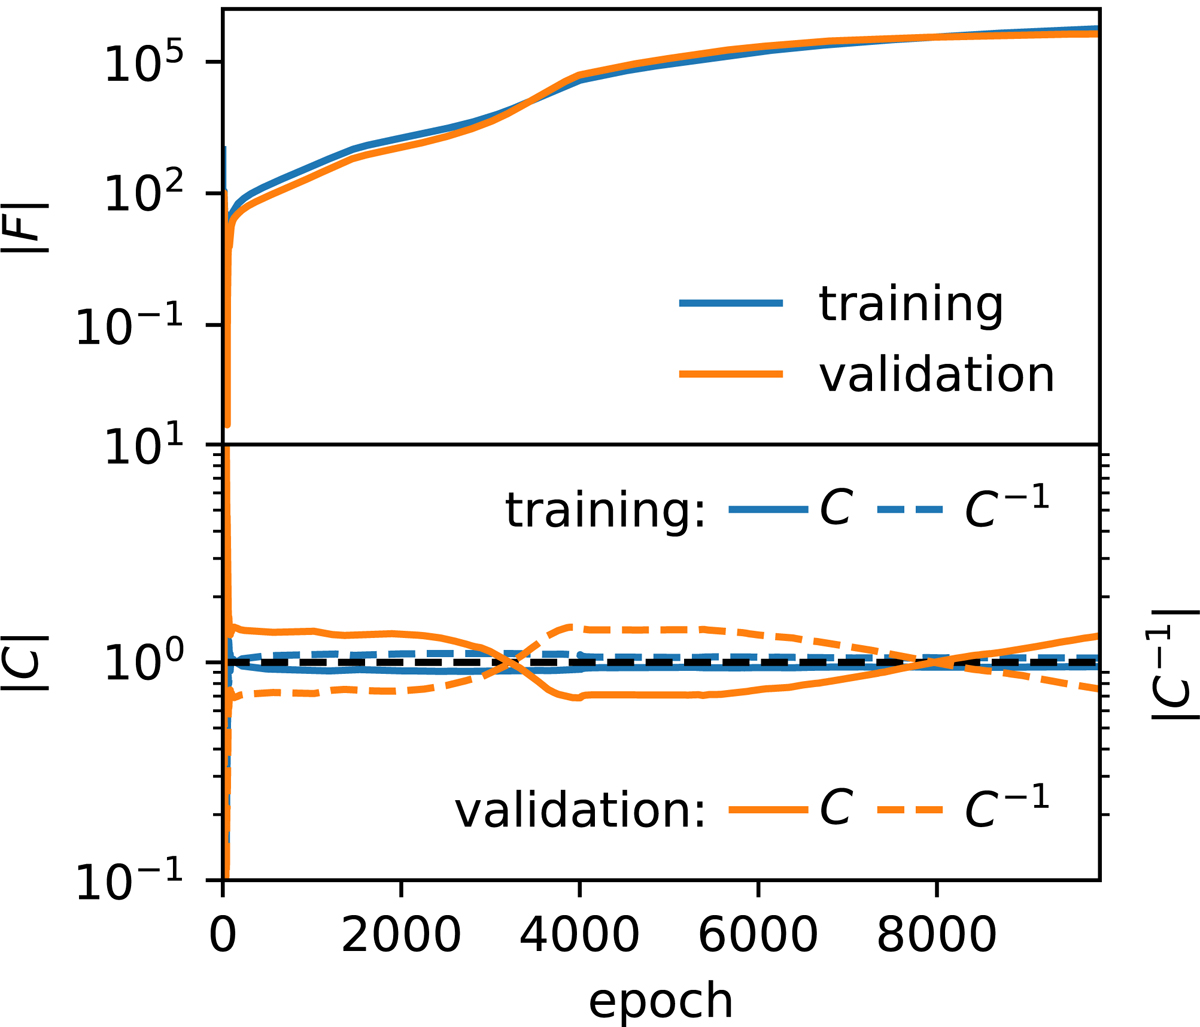
Top panel: evolution of the determinant of the Fisher information matrix during almost 10 000 epochs. The blue curve represents the information extracted from the training set, and the orange curve shows the same from the validation set. The curves increase, which means that the network learns more about the two parameters as the training continues. The training was stopped when the validation curve flattened, suggesting that the network has converged. Bottom panel: evolution of the determinant of the covariance matrix (solid line) and the inverse of the covariance matrix (dashed line). The blue curves show the training set, and the orange curves show the validation set. The training curves reach 1 very fast, which shows that the loss is stabilized and that the magnitude of the summaries is under control. The validation curve oscillates while being still very close to identity, which is a sign that there is some weak parameter dependence on the covariance.
Current usage metrics show cumulative count of Article Views (full-text article views including HTML views, PDF and ePub downloads, according to the available data) and Abstracts Views on Vision4Press platform.
Data correspond to usage on the plateform after 2015. The current usage metrics is available 48-96 hours after online publication and is updated daily on week days.
Initial download of the metrics may take a while.