Fig. 11.
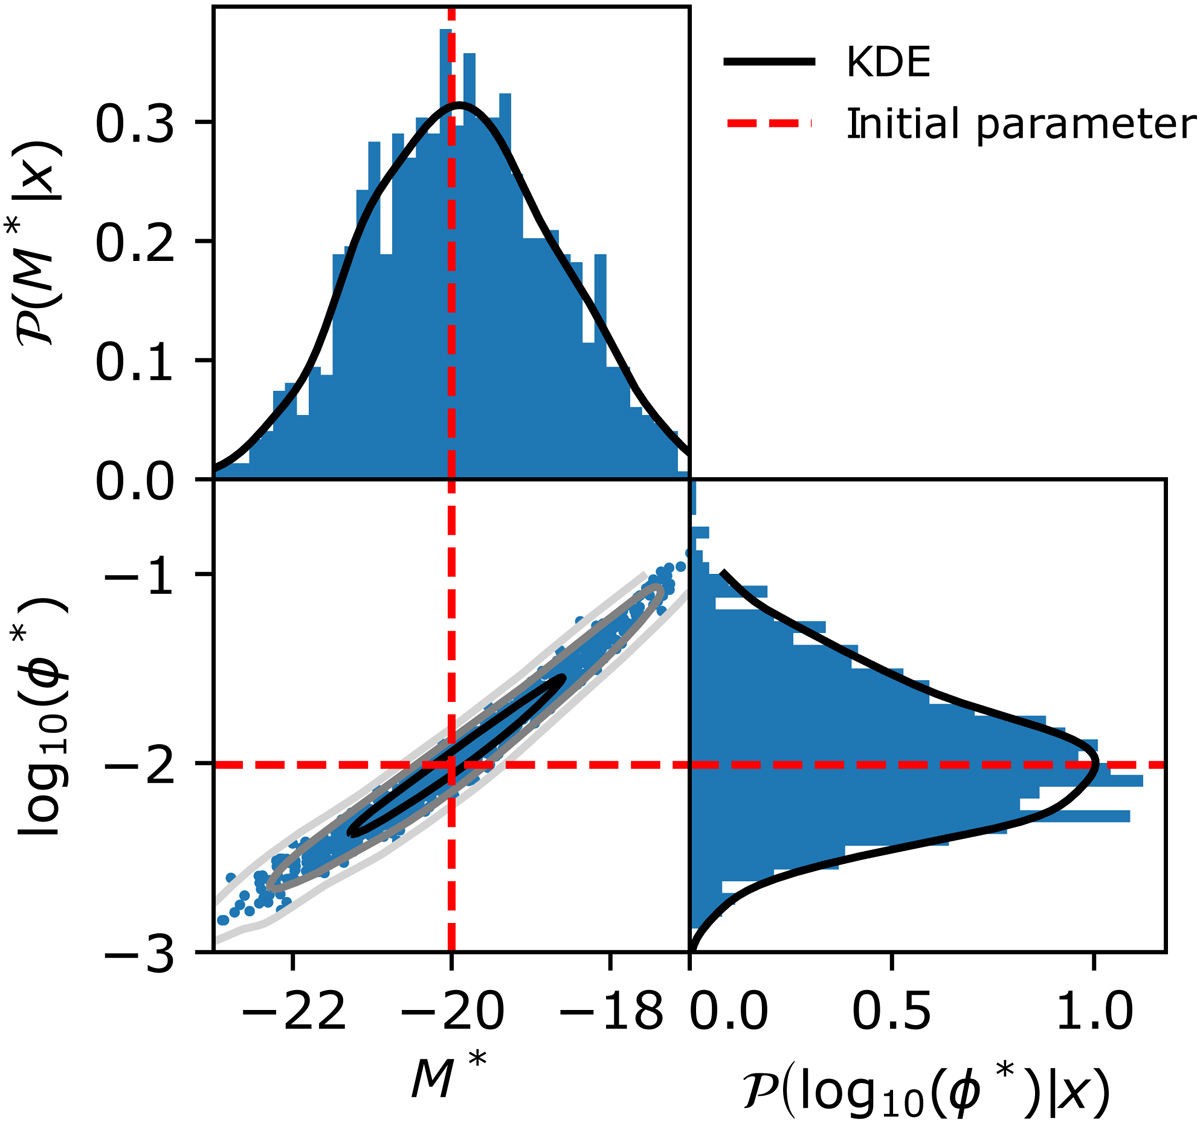
Results of the PMC procedure. Bottom left panel: distribution of the parameter values for final 1000 points obtained by the PMC. The black and dark, gray and light, and gray show the 68%, 95%, and 99% contours, and the dotted red line shows the values of the parameters that were used to generate the virtual data. Top left and bottom right panel: 1D marginal distributions of the parameters and their KDE in black. The procedure converged around the parameter values we used to generate the virtual data. There is evidence here, in 2D, that the uncertainty due to the correlation between the parameters whose effect is evident in the data is large, see Fig. 8.
Current usage metrics show cumulative count of Article Views (full-text article views including HTML views, PDF and ePub downloads, according to the available data) and Abstracts Views on Vision4Press platform.
Data correspond to usage on the plateform after 2015. The current usage metrics is available 48-96 hours after online publication and is updated daily on week days.
Initial download of the metrics may take a while.