Fig. 1.
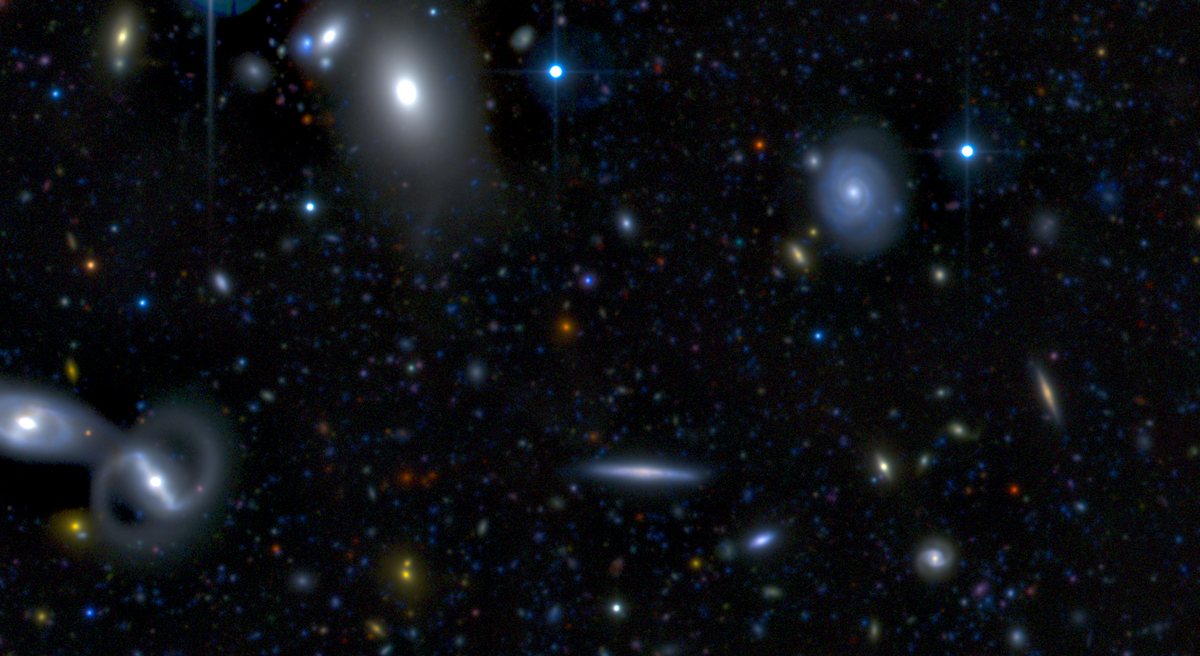
3 × 6 arcmin2 of the 1 deg2 CFHTLS D1 deep field in RGB (using the i′, r′, g′ filters). This shows the diversity of sizes, shapes, and colors that we can use to perform a deep statistical study of the various galaxy populations. This image reveals the complexity of the object distribution and the huge wealth of information that is available in such a field. This complexity presents a barrier in the methods we used to constrain the parameters of the luminosity functions for each population of galaxies.
Current usage metrics show cumulative count of Article Views (full-text article views including HTML views, PDF and ePub downloads, according to the available data) and Abstracts Views on Vision4Press platform.
Data correspond to usage on the plateform after 2015. The current usage metrics is available 48-96 hours after online publication and is updated daily on week days.
Initial download of the metrics may take a while.