Open Access
Fig. 5.
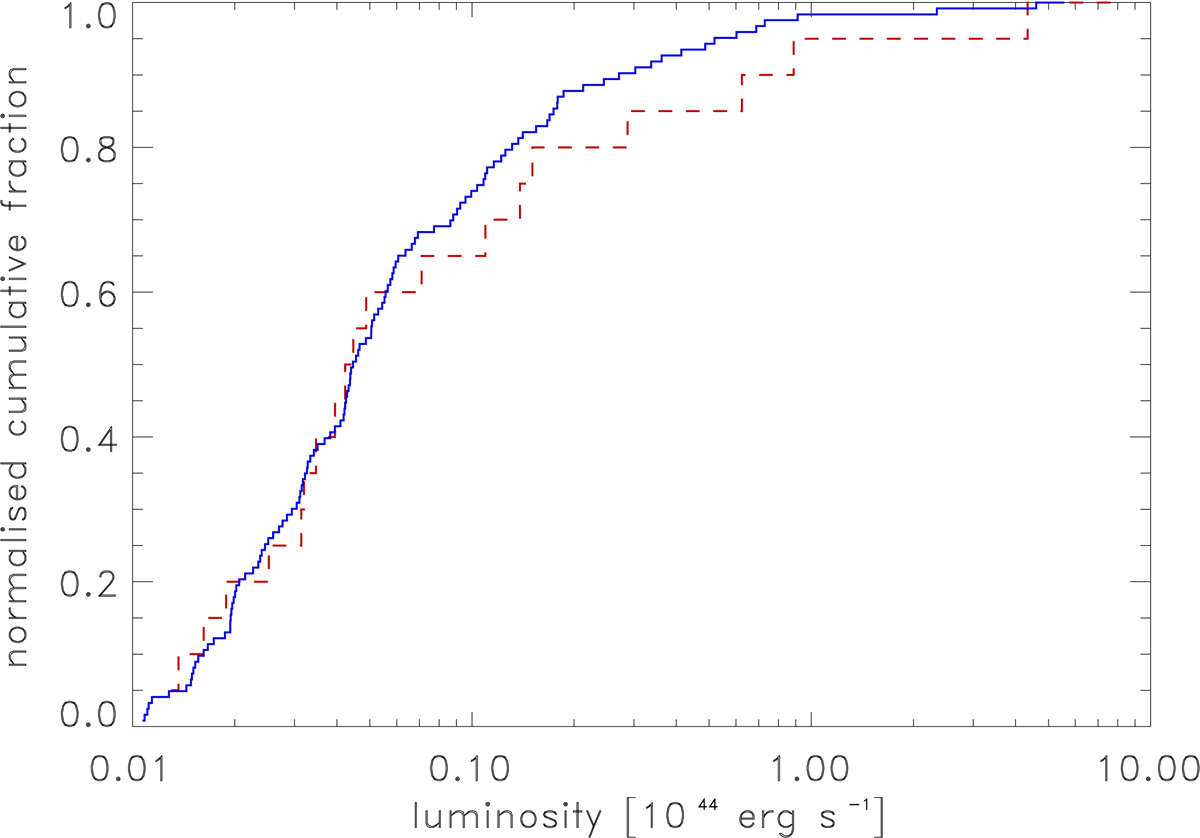
Cumulative normalised distribution of the X-ray luminosity of the groups and clusters of galaxies in the Perseus-Pisces SC (at z ≤ 0.03) (red dashed line) compared to the luminosity distribution of the systems outside the Perseus-Pisces SC and the Southern Great Wall (blue solid line).
Current usage metrics show cumulative count of Article Views (full-text article views including HTML views, PDF and ePub downloads, according to the available data) and Abstracts Views on Vision4Press platform.
Data correspond to usage on the plateform after 2015. The current usage metrics is available 48-96 hours after online publication and is updated daily on week days.
Initial download of the metrics may take a while.