Fig. A.6.
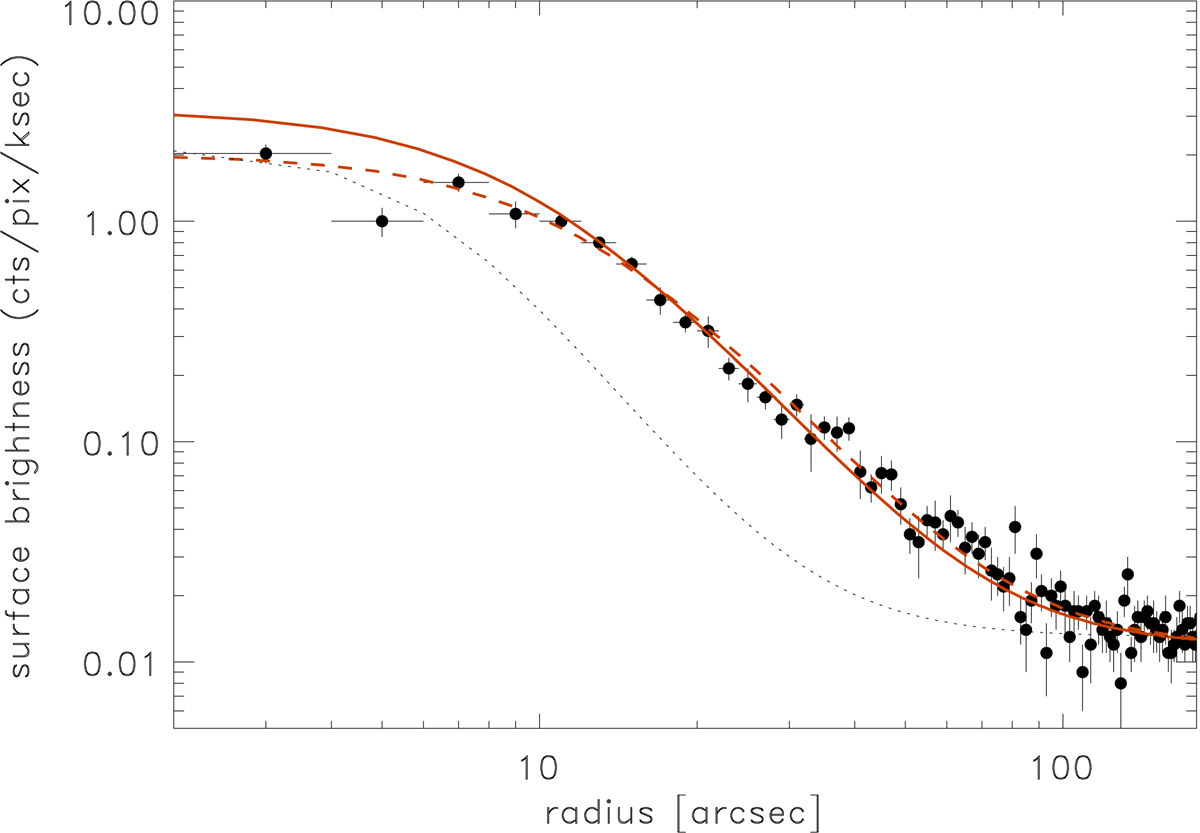
X-ray surface brightness profile of NGC 410 traced by the MOS detectors of XMM-Newton (data points with error bars). Also shown is the profile of the point spread function (dotted curve). The red lines show the best fit of a beta-model, where the dashed line gives the source profile convolved with the point spread function, which was fitted, and the solid line the deconvolved profile.
Current usage metrics show cumulative count of Article Views (full-text article views including HTML views, PDF and ePub downloads, according to the available data) and Abstracts Views on Vision4Press platform.
Data correspond to usage on the plateform after 2015. The current usage metrics is available 48-96 hours after online publication and is updated daily on week days.
Initial download of the metrics may take a while.