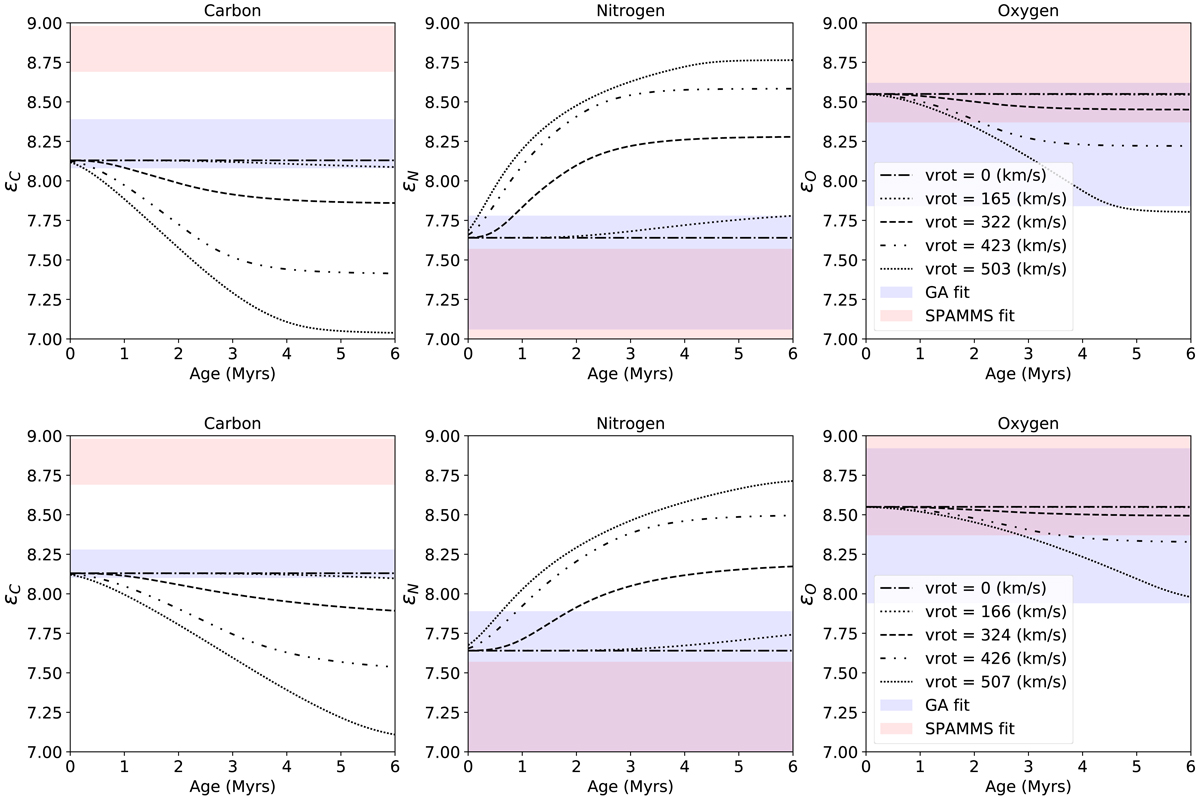
Fig. 5.

Surface abundances for V382 Cyg of carbon (left), nitrogen (middle), and oxygen (right) for the primary (top) and secondary star (bottom) are plotted as a function of age. Single-star Galactic-metallicity evolutionary tracks from Brott et al. (2011; black lines) with initial masses of 25 M⊙ for the primary and 20 M⊙ for the secondary with various initial rotational velocities are overplotted. The shaded blue regions are the inferred range of surface abundances produced by the GA, and the shaded red regions are the surface abundance ranges produced by SPAMMS. The shaded region from the GA represent a 2σ confidence interval, and the shaded region from SPAMMS represents a 1σ confidence interval.
Current usage metrics show cumulative count of Article Views (full-text article views including HTML views, PDF and ePub downloads, according to the available data) and Abstracts Views on Vision4Press platform.
Data correspond to usage on the plateform after 2015. The current usage metrics is available 48-96 hours after online publication and is updated daily on week days.
Initial download of the metrics may take a while.


