Fig. 4.
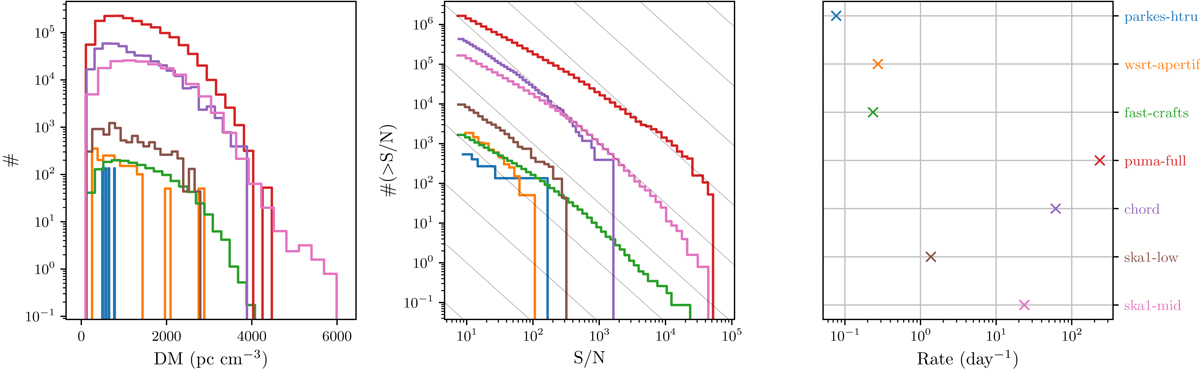
Expected observations of one-off FRBs by current and future surveys. Left: simulated dispersion measure distributions for various surveys. Middle: log N − log S distributions showing the number of detections above a S/N threshold for several surveys. Right: expected rates for each survey based on frbpoppy simulations. All rates have been set such that the simulated Parkes-HTRU rate corresponds to the observed Parkes-HTRU rate. We note that the size of this set of simulated detected Parkes-HTRU FRBs was large enough to produce reliable rates, but not large enough to properly sample the Parkes-HTRU distributions in the left panel.
Current usage metrics show cumulative count of Article Views (full-text article views including HTML views, PDF and ePub downloads, according to the available data) and Abstracts Views on Vision4Press platform.
Data correspond to usage on the plateform after 2015. The current usage metrics is available 48-96 hours after online publication and is updated daily on week days.
Initial download of the metrics may take a while.