Fig. 2.
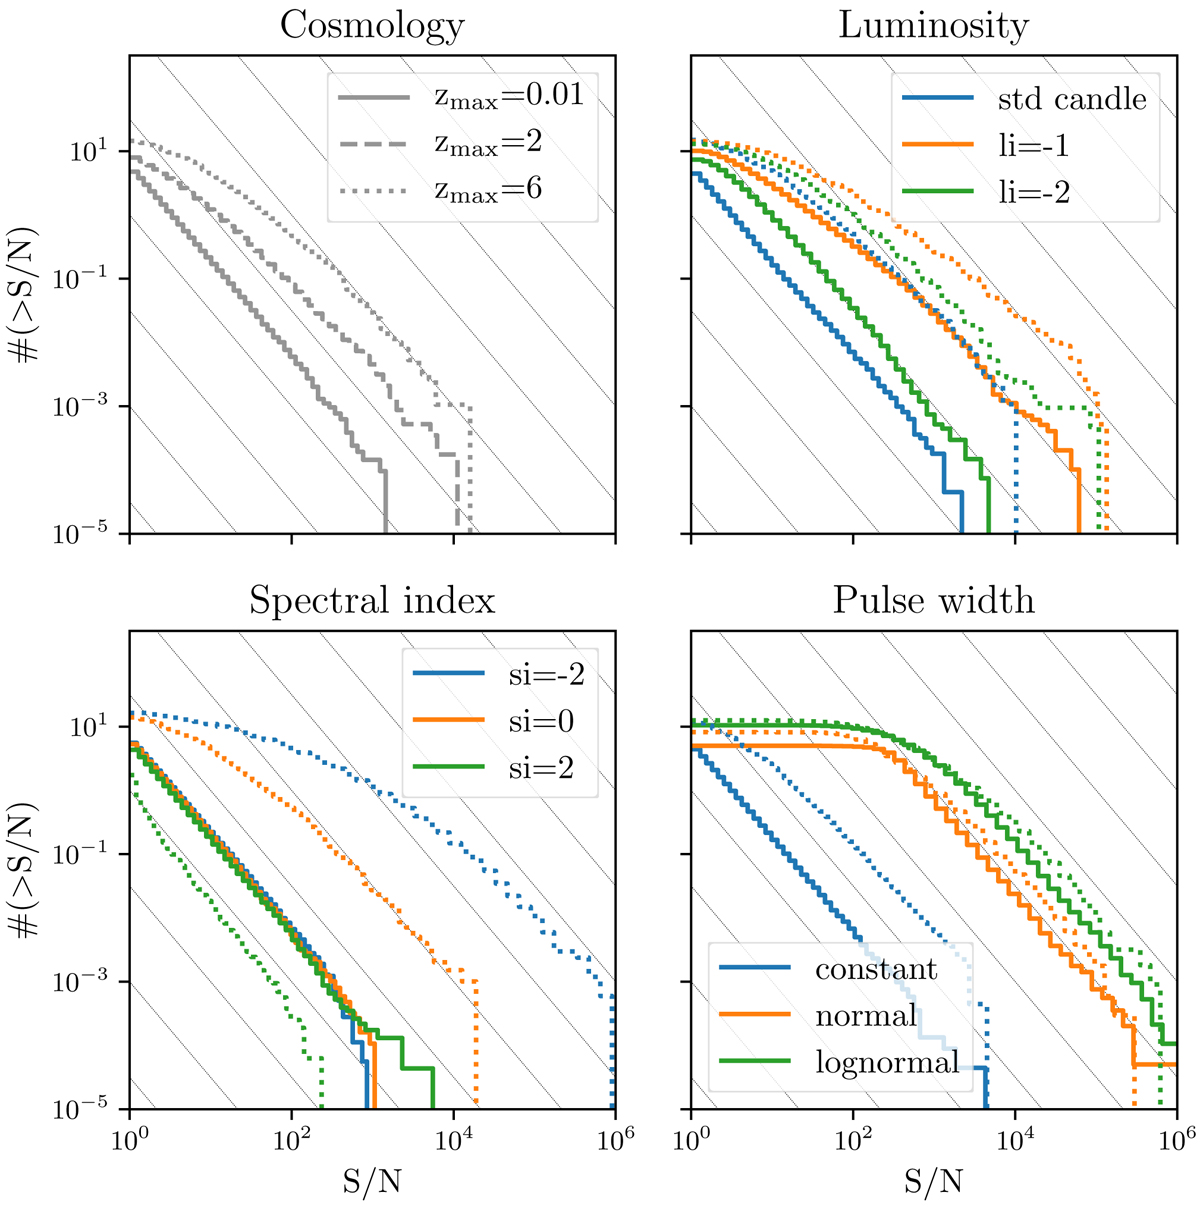
Cumulative distribution of the number of detected FRBs greater than a limiting S/N. Each panel shows the effect on the detected S/N from three different inputs for the parameter denoted above the panel. Each panel additionally shows the cosmological effect on the various input distributions, denoted by the line styles given in the top left plot. Simulated observed S/N distributions can be seen for intrinsic source populations spanning various redshifts (top left), various intrinsic luminosity distributions (top right), various spectral indices (bottom left), and various intrinsic pulse-width distributions (bottom right). We note that considering the arbitrary nature of a S/N threshold for a perfect survey, all distributions were normalised to a S/N of one (i.e. the distributions are left aligned). This allows for a cleaner comparison between trends. Each panel additionally features thin grey Euclidean lines with a slope of −3/2, such that various distributions can easily be compared.
Current usage metrics show cumulative count of Article Views (full-text article views including HTML views, PDF and ePub downloads, according to the available data) and Abstracts Views on Vision4Press platform.
Data correspond to usage on the plateform after 2015. The current usage metrics is available 48-96 hours after online publication and is updated daily on week days.
Initial download of the metrics may take a while.