Fig. 1.
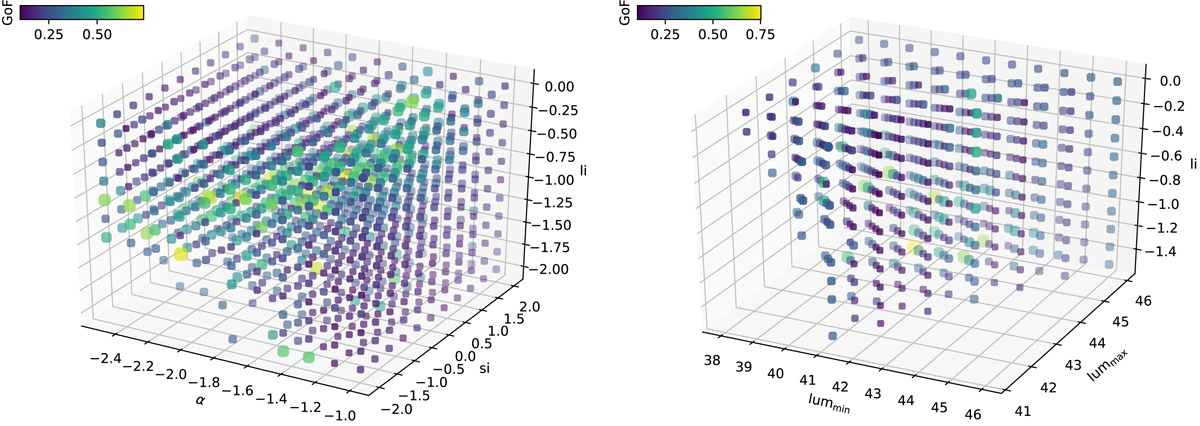
Goodness-of-fit (GoF) spaces spanned by two different sets of parameters. Higher GoFs are denoted both in brighter colours and larger markers. Left panel: an example is seen of a clear optimal region of a parameter space. In comparison to the right panel, this shows a parameter space with no clear optimal region. Each marker represents the weighted median GoF reflecting the results of multiple surveys in multiple dimensions.
Current usage metrics show cumulative count of Article Views (full-text article views including HTML views, PDF and ePub downloads, according to the available data) and Abstracts Views on Vision4Press platform.
Data correspond to usage on the plateform after 2015. The current usage metrics is available 48-96 hours after online publication and is updated daily on week days.
Initial download of the metrics may take a while.