Open Access
Fig. 8.
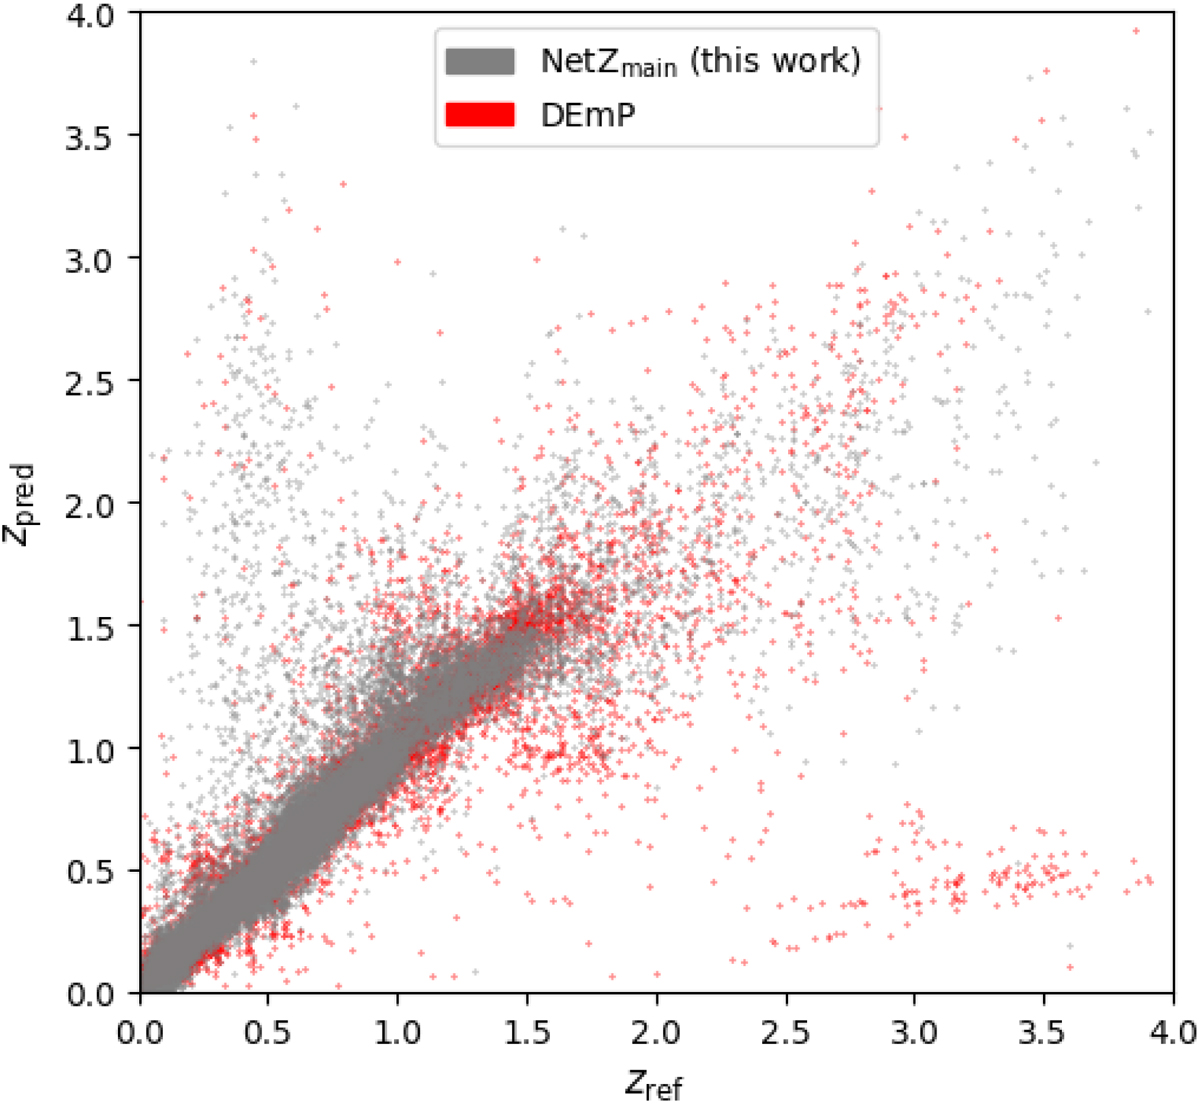
Network performance as scatter plot comparing the predicted with the reference redshifts for NetZmain (this work) and DEmP (Hsieh & Yee 2014). The scatter looks overall comparable at zref ≲ 2, while NetZmain does not contain the catastrophic outliers at zref ∼ 3 and zpred ∼ 0.5 that DEmP has.
Current usage metrics show cumulative count of Article Views (full-text article views including HTML views, PDF and ePub downloads, according to the available data) and Abstracts Views on Vision4Press platform.
Data correspond to usage on the plateform after 2015. The current usage metrics is available 48-96 hours after online publication and is updated daily on week days.
Initial download of the metrics may take a while.