Fig. 7.
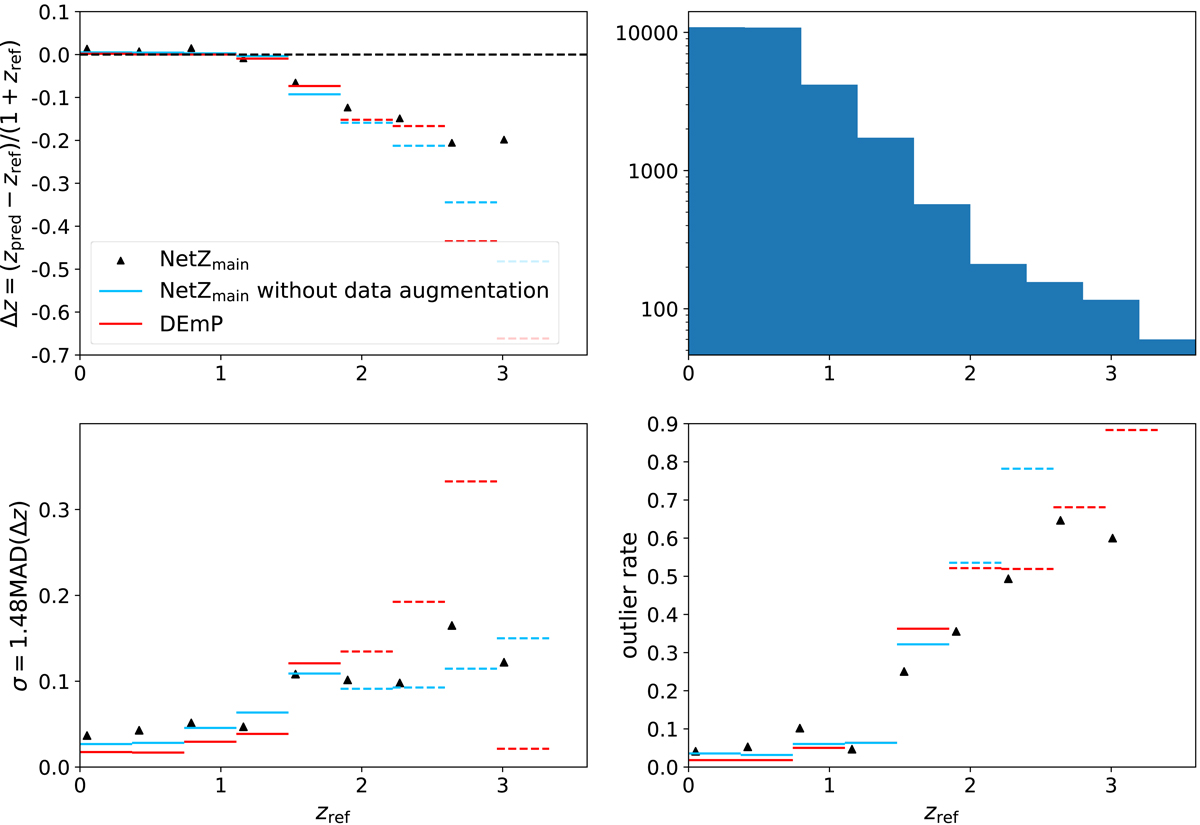
NetZmain (black points) performance in terms of bias (top-left panel), dispersion (bottom-left panel), and outlier rate (bottom-right panel) as functions of the reference redshift zref in comparison to DEmP (red bars). Definitions of bias, dispersion and outlier rate are given in Eqs. (2)–(4). We show also with blue bars the results from a network where we do not use data augmentation to increase the number of high-z galaxies. The values in dashed bars are based on limited number of galaxies. The histogram in the top-right panel shows the number of galaxies as a function of redshift in the test set T used for the comparison. NetZ performs substantially better than DEmP at zref ≳ 2, with smaller bias, lower dispersion and lower outlier rate, by up to a factor of 2.
Current usage metrics show cumulative count of Article Views (full-text article views including HTML views, PDF and ePub downloads, according to the available data) and Abstracts Views on Vision4Press platform.
Data correspond to usage on the plateform after 2015. The current usage metrics is available 48-96 hours after online publication and is updated daily on week days.
Initial download of the metrics may take a while.