Fig. 5.
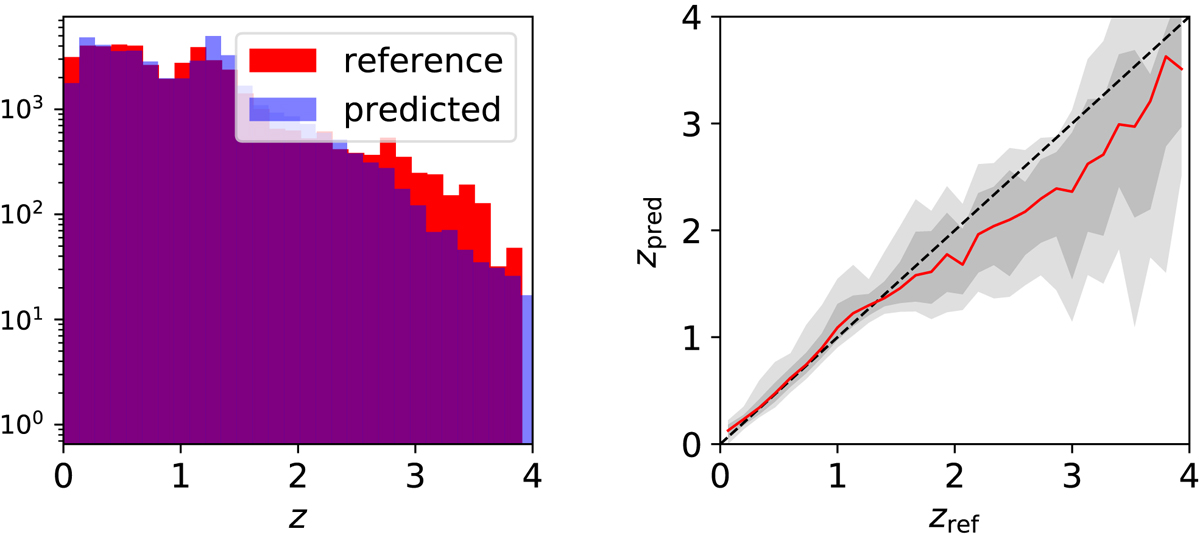
Performance of the final network on the test set T. Left hand side: histograms of the reference and predicted redshift distributions in red and blue, respectively. Right hand side: a 1:1 comparison of reference and predicted redshifts. The red line shows the median predicted redshift per bin and the gray bands the 1σ and 2σ confidence levels. While the red line follows the black dashed reference line for low redshift very nicely, NetZmain tends to underpredict the high end.
Current usage metrics show cumulative count of Article Views (full-text article views including HTML views, PDF and ePub downloads, according to the available data) and Abstracts Views on Vision4Press platform.
Data correspond to usage on the plateform after 2015. The current usage metrics is available 48-96 hours after online publication and is updated daily on week days.
Initial download of the metrics may take a while.