Fig. 3.
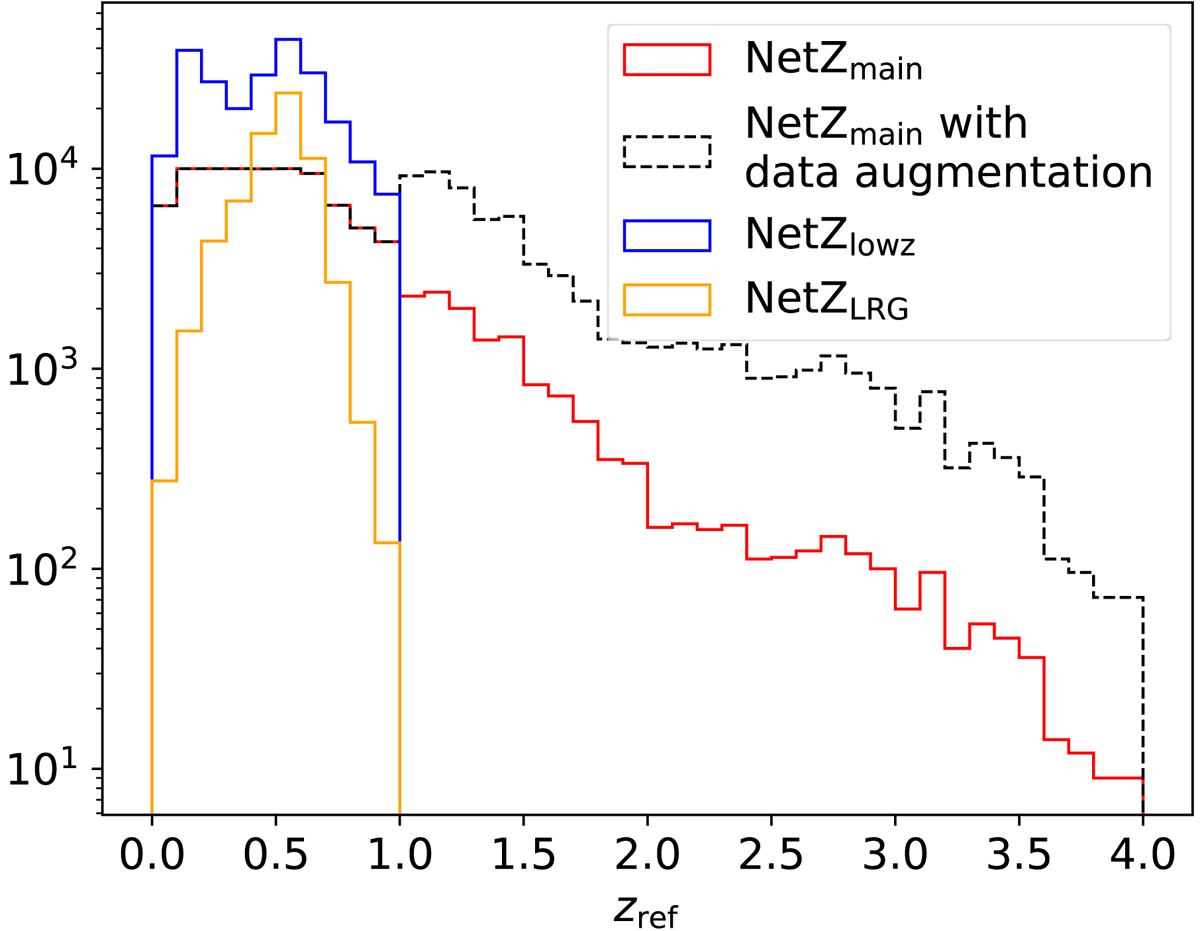
Histograms of the redshift samples used in this work. For NetZmain, we show the original redshift distribution in red, and the data augmented distribution in dashed black (with more galaxies at zref > 1) that was used for our final network. The distribution used to train our two specialized networks (see Sect. 6 for details) is overplotted for NetZlowz in blue and for NetZLRG in orange.
Current usage metrics show cumulative count of Article Views (full-text article views including HTML views, PDF and ePub downloads, according to the available data) and Abstracts Views on Vision4Press platform.
Data correspond to usage on the plateform after 2015. The current usage metrics is available 48-96 hours after online publication and is updated daily on week days.
Initial download of the metrics may take a while.