Fig. 12.
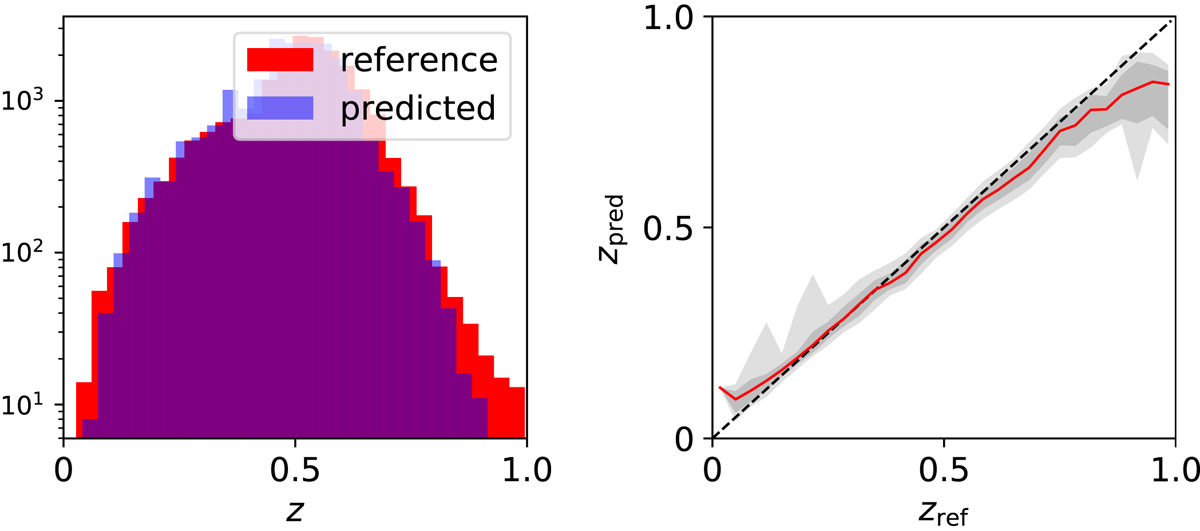
Performance of the network NetZLRG (bottom) trained on LRGs only. Left-hand side: histograms of the redshift distributions in red we show the distribution of the reference redshifts used to train the network (ground truth) and in blue the predicted redshift distribution. Right panel: a 1:1 comparison of reference and predicted redshifts. The red lines show the median and the gray bands the 1σ and 2σ confidence levels.
Current usage metrics show cumulative count of Article Views (full-text article views including HTML views, PDF and ePub downloads, according to the available data) and Abstracts Views on Vision4Press platform.
Data correspond to usage on the plateform after 2015. The current usage metrics is available 48-96 hours after online publication and is updated daily on week days.
Initial download of the metrics may take a while.