Fig. 6.
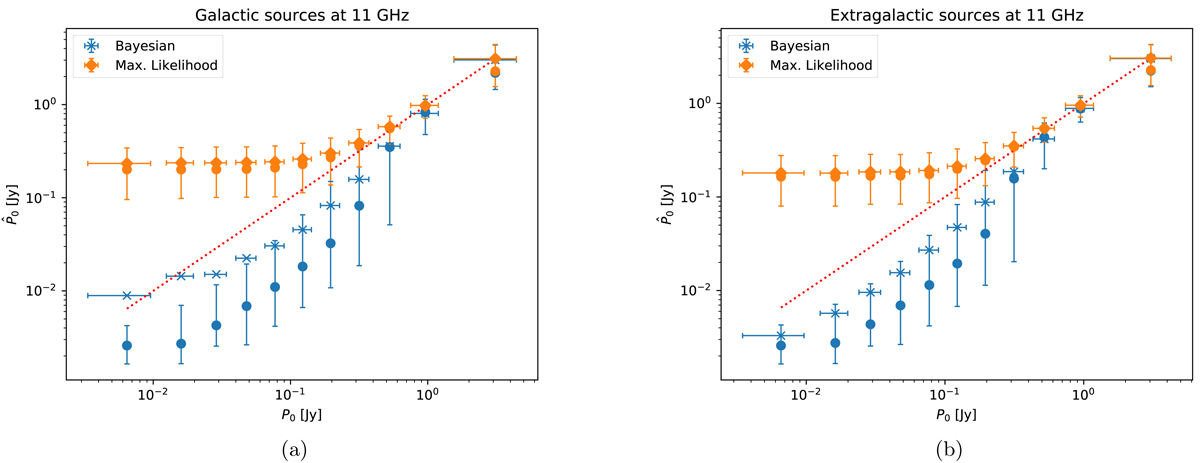
Binned estimates of the polarised flux density as a function of binned input P0, in Janskys, for the set of 10 000 simulated QUIJOTE sky patches with |b|≤10° (left) and the set of 10 000 simulated QUIJOTE sky patches with |b|> 10° (right) at 11 GHz. Bayesian estimations appear in blue, whereas maximum likelihood estimations are shown with an orange colour. Error bars show the 68.27% interval of the distribution of results in each case. Filled circles indicate the median of the distribution; the diamonds (for the MLE) and crosses (for the Bayesian estimator) indicate the average value of the distribution.
Current usage metrics show cumulative count of Article Views (full-text article views including HTML views, PDF and ePub downloads, according to the available data) and Abstracts Views on Vision4Press platform.
Data correspond to usage on the plateform after 2015. The current usage metrics is available 48-96 hours after online publication and is updated daily on week days.
Initial download of the metrics may take a while.