Fig. 11
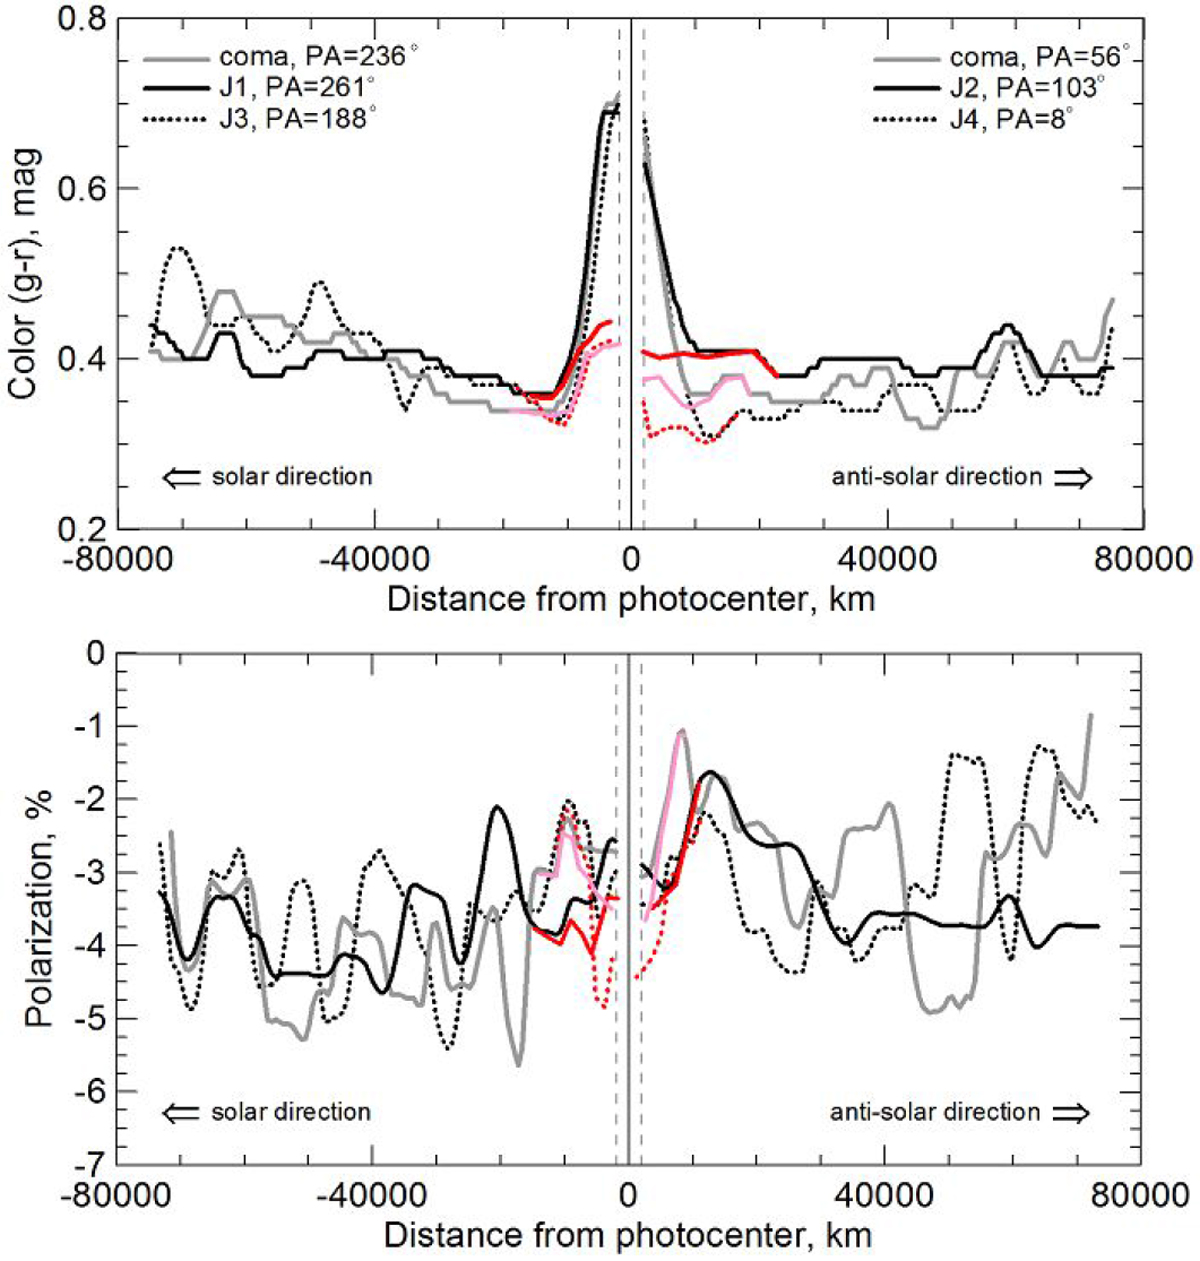
Radial profiles across the g – r color (top panel) and polarization (bottom panel) maps of comet C/2011 KP36 (Spacewatch). The individual curves are scans measured from the photometric center of the comet through the J1, J2, J3, and J4 jets and the coma in different directions: the solid black line is the cuts along the J1and J2; the dotted line is the cuts along the J3 and J4; the solid gray line is the cuts across the nucleus and coma in the directions with PA = 56° and PA = 236°. The radial profiles of the dust color without the nucleus contribution are marked by colored lines. Zero point is at the photometric center of the comet. Vertical dashed lines show the size of the seeing disc during the observations. Negative distance is in the solar direction, and positive distance is in the antisolar direction.
Current usage metrics show cumulative count of Article Views (full-text article views including HTML views, PDF and ePub downloads, according to the available data) and Abstracts Views on Vision4Press platform.
Data correspond to usage on the plateform after 2015. The current usage metrics is available 48-96 hours after online publication and is updated daily on week days.
Initial download of the metrics may take a while.