| Issue |
A&A
Volume 651, July 2021
|
|
|---|---|---|
| Article Number | A6 | |
| Number of page(s) | 11 | |
| Section | The Sun and the Heliosphere | |
| DOI | https://doi.org/10.1051/0004-6361/201936231 | |
| Published online | 01 July 2021 | |
ALMA small-scale features in the quiet Sun and active regions
1
Hvar Observatory, Faculty of Geodesy, University of Zagreb, Kačićeva 26, 10000 Zagreb, Croatia
e-mail: This email address is being protected from spambots. You need JavaScript enabled to view it.
2
University of Applied Sciences and Arts Northwestern Switzerland, Bahnhofstrasse 6, 5210 Windisch, Switzerland
3
Institute for Particle Physics and Astrophysics, ETH Zurich, 8093 Zurich, Switzerland
4
Space Sciences Laboratory, University of California, Berkeley, CA 94720-7450, USA
5
Landessternwarte, Zentrum für Astronomie der Universität Heidelberg, Königstuhl 12, 69117 Heidelberg, Germany
6
Harvard-Smithsonian Center for Astrophysics, 60 Garden Street, Cambridge, MA 02138, USA
7
NAT – Núcleo de Astrofísica, Universidade Cruzeiro do Sul/Universidade Cidade de São Paulo, São Paulo, SP, Brazil
Received:
3
July
2019
Accepted:
15
February
2021
Abstract
Aims. The main aim of the present analysis is to decipher (i) the small-scale bright features in solar images of the quiet Sun and active regions obtained with the Atacama Large Millimeter/submillimeter Array (ALMA) and (ii) the ALMA correspondence of various known chromospheric structures visible in the Hα images of the Sun.
Methods. Small-scale ALMA bright features in the quiet Sun region were analyzed using single-dish ALMA observations (1.21 mm, 248 GHz) and in an active region using interferometric ALMA measurements (3 mm, 100 GHz). With the single-dish observations, a full-disk solar image is produced, while interferometric measurements enable the high-resolution reconstruction of part of the solar disk, including the active region. The selected quiet Sun and active regions are compared with the Hα (core and wing sum), EUV, and soft X-ray images and with the magnetograms.
Results. In the quiet Sun region, enhanced emission seen in the ALMA is almost always associated with a strong line-of-sight magnetic field. Four coronal bright points were identified, while other small-scale ALMA bright features are most likely associated with magnetic network elements and plages. In the active region, in 14 small-scale ALMA bright features randomly selected and compared with other images, we found five good candidates for coronal bright points, two for plages, and five for fibrils. Two unclear cases remain: a fibril or a jet, and a coronal bright point or a plage. A comparison of the Hα core image and the 3 mm ALMA image of the analyzed active region showed that the sunspot appears dark in both images (with a local ALMA radiation enhancement in sunspot umbra), the four plage areas are bright in both images and dark small Hα filaments are clearly recognized as dark structures of the same shape also in ALMA.
Key words: Sun: chromosphere / Sun: corona / Sun: radio radiation / Sun: magnetic fields / Sun: X-rays, gamma rays / Sun: UV radiation
© ESO 2021
1. Introduction
The solar chromosphere, the main source region for the solar radiation at millimeter and submillimeter wavelengths, is not understood to a satisfactory level. It is dynamically coupled with the photosphere below and with the transition region and corona above (Gabriel 1992; Golub & Pasachoff 1997). The Atacama Large Millimeter/submillimeter Array (ALMA)1,2 enables important new observations of this layer of the solar atmosphere (Bastian et al. 2018; Loukitcheva 2019), using both its single-dish (White et al. 2017) and interferometric (Shimojo et al. 2017a) observing modes.
The main source of ALMA emission at millimeter wavelengths is thermal bremsstrahlung, that is, electron-ion free-free transitions (Wedemeyer et al. 2016; Brajša et al. 2018a). For λ = 1 mm, the contribution function includes the heights in the 400–1400 km range, with the maximum at h = 700 km, while for λ = 3 mm the contribution function covers the 600–1600 km range, with the maximum at h = 950 km (Wedemeyer et al. 2016).
The present analysis relates small-scale ALMA features to known solar structures. The main candidates in our focus are coronal bright points (CBPs), chromospheric plages, magnetic network, Hα fibrils, and filaments.
We note that CBPs belong to the solar corona, while ALMA maps the solar chromosphere. So, the present analysis refers in fact to the chromospheric correspondence of CBPs.
The CBPs are small-scale coronal loops observed with enhanced emission in UV, EUV, and X-rays (see e.g., the review by Madjarska 2019). These loops are always associated with magnetic elements of opposite polarities as seen in magnetogram data. About 50% of CBPs are related to newly emerging flux regions, while others are related to random encounters of magnetic flux (Mou et al. 2016, 2018). At chromospheric and transition-region temperatures, it is mainly the footpoints of the CBP loops that are visible (Madjarska 2019).
In spite of different morphological forms being revealed in EUV images of the Sun (point-like structures, small loops, and small active regions; Brajša et al. 2001, 2002), CBPs can be regarded as downscaled active regions (Madjarska 2019) and may contribute to the coronal heating (e.g., von Rekowski et al. 2006).
Harvey (1985) reported that the CBPs are associated with He I 10830 Å dark points (localized regions of enhanced He I absorption). That study was followed by comprehensive analyses of CBPs identified at the wavelength of 20 cm with the VLA (Habbal et al. 1986; Habbal & Harvey 1988). The main results of previous radio observations of CBPs at cm wavelengths were summarized by Madjarska (2019). Solar observations with ALMA provide an extension of these efforts to the smaller wavelengths in the millimeter and submillimeter wavelength ranges.
The motions of CBPs were used as tracers for studying solar rotation including transport of angular momentum toward equator (Brajša et al. 2002; Wöhl et al. 2010; Sudar et al. 2015, 2016) and turbulent diffusion (Brajša et al. 2008, 2015; Skokić et al. 2016, 2019). Brajša et al. (2004) found the height of CBPs in the 8000–12 000 km range using the Solar and Heliospheric Observatory (SOHO) Extreme ultraviolet Imaging Telescope (EIT) data (284 Å channel), and Sudar et al. (2016) found heights of about 6500 km using the Solar Dynamics Observatory (SDO) Atmospheric Imaging Assembly (AIA) data (193 Å channel). These results are in general agreement with the ones obtained by Kwon et al. (2010, 2012) using the stereoscopic method.
Localized bright patches in polar regions of the Sun were investigated at 17 GHz using the Nobeyama Radioheliograph (NoRH) by Selhorst et al. (2017). The authors concluded that the increased emission of the 17 GHz bright patches comes from changes in the chromospheric plasma, instead of the coronal ones observed in the EUV lines. In an earlier study of small bright patches in 17 GHz NoRH maps (Nitta et al. 2014), it was not possible to find a correlation between the 17 GHz polar sources and small-scale bright regions in the SDO-AIA images, and it was concluded that the 17 GHz sources might be artifacts created by the image synthesis and deconvolution used in the NoRH maps. This is an additional motivation to devote particular attention to the image reconstruction of ALMA data, especially regarding image orientation, co-alignment, and so on.
We now briefly summarize earlier results on CBPs obtained with ALMA. Shimojo et al. (2017b) observed a plasmoid ejection from a CBP in solar active region simultaneously at millimeter wavelengths with ALMA, at EUV wavelengths with SDO-AIA, and in soft X-rays with the Hinode X-ray Telescope (XRT). The authors concluded that the plasmoid consists either of approximately isothermal plasma with T ≈ 105 K that is optically thin at 100 GHz, or a core with T ≈ 104 K and a hot envelope. The analysis showed the value of the additional temperature and density constraints provided by ALMA. Rodger et al. (2019) analyzed the spectrum of the plasma eruption using subband data within the ALMA Band 3. They concluded that both stationary and moving enhancements of radiation are partially optically thick at 100 GHz. The electron temperatures were estimated to lie between 7370 K and 15 300 K for the stationary elements and between 7440 and 9560 K for the moving elements. Plasmoid ejection from a CBP is further analyzed in the present work.
Brajša et al. (2018b) compared the full-disk solar ALMA image at λ = 1.21 mm with simultaneous Hα, He I, and EUV images as well as with a magnetogram. They found that active regions appear as bright areas in ALMA observations, while prominences on the disk and coronal holes are barely discernible from the quiet Sun background and have a slightly lower intensity than surrounding quiet Sun regions. Magnetic inversion lines appear as large, elongated dark structures. The CBPs show a high correspondence with ALMA bright features: the vast majority (75%) of all CBPs from the EUV image correspond to He I 10830 Å dark points, and the vast majority (82%) of all CBPs from the EUV image correspond to the ALMA 1.21 mm bright points.
Most parts of active region areas are occupied by bright plages (Martres 1977; Zirin 1988, 1992; Gurman 1992). The chromospheric plage is an extended emission region observed in strong chromospheric lines such as Hα and He II 304 Å. These bright regions in the Hα core correspond to longitudinal (vertical) magnetic field peaks of approximately 1000 Gauss and up to 1500 Gauss. Above the plage is a coronal condensation emitting enhanced EUV, X-ray, and radio emission. These structures are hotter and have a higher density than the surrounding regions and may form a magnetic canopy (Solanki 1993, 2004). Outside active regions, plages are usually simply called network elements and consist of unipolar magnetic regions, where the magnetic network is relatively strong and of one polarity. As in active regions, the network is bright in the Hα core.
Plage and network magnetic fields are distinguished from each other by the fact that the magnetic field typically present in a plage is higher. Plages are found inside active regions, while network fields are present all over the Sun (including the decay products of active regions, which form the so-called enhanced network) but concentrated mainly at the edges of supergranules with a length scale of 15–30 mm (Borrero et al. 2017). At photospheric height, where most of the measurements of solar magnetic fields were taken, both plage regions and the network elements are composed of groups of more or less discrete magnetic flux concentrations (Borrero et al. 2017).
Chromospheric fibrils are dark, elongated structures visible in Hα (centerline or off band) with a width of 725–2200 km and an average length of 11 000 km (Martres 1977; Zirin 1988). They mark horizontal lines of force connecting opposite magnetic polarity, and so they may be used to estimate the configuration of the magnetic field in and around active regions. Fibrils play an important role in the process of filament formation when fibrils no longer connect the areas of opposite polarities but curve into the polarity inversion zone that will form the filament channel (Tandberg-Hanssen 1995). In this way, fibrils play an important role in filament formation and are closely related to them (Aschwanden 2019).
Recently, Rutten & Rouppe van der Voort (2017) and Rutten (2017) performed an extensive new analysis of chromospheric fibrils. They introduced three subclasses of fibrils, and the most interesting one is the so-called contrail fibril representing the track of the cooling gas along the path where a transient dynamic heating event took place several minutes before. Moreover, Rutten (2017) predicted that at the ALMA wavelengths the general appearance of the solar atmosphere would be similar to the Hα images with a good dark-dark correspondence, but with greater fibril opaquenesses at millimeter wavelengths, which increases with wavelength and with less lateral fibril contrast due to a lack of sensitivity to Doppler shifts. For the present work, we investigated this hypothesis.
In this paper, we present an analysis of various features observed by ALMA in quiet and active regions on the Sun. We raise two main scientific questions. Firstly, what are the small-scale bright features in solar ALMA images and particularly in the quiet Sun observed in single-dish mode and in the active region using the interferometric mosaic? Secondly, how do the chromospheric structures visible in the Hα images relate to features of ALMA images? This paper extends the results of Brajša et al. (2018b) by studying, in detail, several ALMA features in a quiet region and by including interferometric observations of an active region. The ALMA images were compared with observations taken in other wavelength ranges (magnetogram, soft X-rays, UV, EUV, and Hα) at the same time. After presenting the results of the analysis, we discuss the relationship of the identified ALMA features with features observed at other wavelengths regarding their intensities, positions, and shapes.
2. Data and reduction methods
2.1. ALMA single-dish data
An image of the whole solar disk from the December 2015 Science Verification campaign is used in the current analysis. The 18 December 2015 full-disk solar map obtained by scanning the solar disk with a 12 m single dish total power ALMA antenna (PM03) at a frequency of 248 GHz corresponding to λ = 1.21 mm in a double circle pattern (Phillips et al. 2015; White et al. 2017) is presented in Fig. 1a. This figure is adapted from Brajša et al. (2018b). The observing wavelength is part of Band 6. We restricted our analysis to that band because on 18 December 2015 no full-disk image in the other observing band (Band 3) was available. This observing day was chosen because of the availability of images in other wavelengths. The observation started at 20:12:21 UT on 18 December 2015 and lasted for about 17 minutes including calibration scans (White et al. 2017). The resulting image has a single-dish beam size of 26″ and is oversampled at 3″ per pixel.
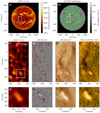 |
Fig. 1. Panel a: single-dish ALMA 248 GHz (1.21 mm, Band 6). Panel b: SDO-HMI magnetogram, with white box outlining the quiet Sun area shown in middle row panels. Both images were taken on 18 December 2015 at 20:12 UT. Magnetogram intensity was clipped at ±120 Gauss and ALMA contours of 6500 K were overlaid in green. Panel c: ALMA image of the quiet Sun shown enlarged and compared with panel d: SDO-HMI magnetogram, panel e: SDO-AIA 193 Å filtergram, and panel f: GOES-13 SXI tin (Sn) filter image, with ALMA contours overlaid (levels at 6300, 6400, 6500, 6600, and 6700 K). Panels g–j: enlargements of a single ALMA bright feature, marked in the white rectangle in panel c, at the same wavelengths as in the middle row. The beam size of the single-dish ALMA measurements, 26″, is given in panel c. |
The standard ALMA calibration method (White et al. 2017) for solar single-dish images was used, which includes a correction (multiplication) factor C applied to account for the antenna efficiency (C = 1.16 for Band 6). Data reduction was performed using the Common Astronomy Software Applications (CASA) package3. The final uncertainty in the brightness temperature is estimated to be about 5–10% (White et al. 2017; Shimojo et al. 2017a). The data reduction and analysis of the single-dish data are described in more detail by Brajša et al. (2018b).
2.2. ALMA interferometric data
We used the Band 3 (ν = 100 GHz, λ = 3.0 mm) image of the active region 12 470 from the ALMA Science Verification data. The data were taken on 16 December 2015 with a heterogeneous array of twenty-one 12 m antennas and nine 7 m antennas. Calibration and imaging were performed in CASA using the procedure described by Shimojo et al. (2017a). The observation was a 149 pointing mosaic with a separation between pointings of 24.1″ (corresponding to the Nyquist sampling) and an integration time for each point of 6.048 s. All four spectral windows (subbands) were combined into a single image for better quality with the final synthesized beam size (spatial resolution) of 4.9″ × 2.2″. The interferometric image was combined with the full-disk single-dish image of the Sun (taken at the same time) using a CASA feather task to recover the absolute flux scale missing from the interferometer data (for details, see Shimojo et al. 2017a). The field of view is 300″ × 300″. The interferometric image is presented in Fig. 2a.
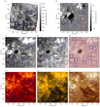 |
Fig. 2. Panel a: interferometric image of the solar active region 12 470 obtained on 16 December 2015 at 100 GHz (3.0 mm) in ALMA Band 3. The calibrated ALMA image has a field of view of 300″ × 300″. The beam size of ALMA is 4.9″ × 2.2″. Panels b–h: images at other wavelengths taken close to the ALMA reference time (18:32 UT). Squares lie at the same positions in all images, denoting selected small-scale ALMA bright features. (a) ALMA 3.0 mm, 18:32:41 UT. (b) SDO/HMI LOS magnetogram, 18:33:45 UT. (c) FDP Hα core, 6563 Å, 18:28−18:54 UT. (d) FDP Hα wing, 6563 Å, 18:28−18:54 UT. (e) SDO/AIA 1700 Å, 18:32:54 UT. (f) SDO/AIA 304 Å, 18:32:42 UT. (g) SDO/AIA 171 Å, 18:32:34 UT. (h) SDO/AIA 193 Å, 18:32:42 UT. |
Details of the interferometric data used here are given in Table 4 in Shimojo et al. (2017a). The observation lasted for 47 minutes, and the reference time was 18:32:41 UT, corresponding roughly to the middle of the observation. The reference time is arbitrarily chosen during data calibration and imaging and is used to fix the interferometer visibility data of the moving target (Sun) to the same time, that is, the same position in the sky.
2.3. SOLIS-FDP Hα data
The Synoptic Optical Long-term Investigations of the Sun (SOLIS) is a synoptic facility designed to study magnetic and non-magnetic solar activity with high spectral and moderate spatial resolution over a long time frame (Keller et al. 2003). The Full Disk Patrol (FDP) is a SOLIS full-disk imager with a resolution of 1″ per pixel4. We used Hα core and wing sum images centered at 6563 Å, taken between 18:28:18 UT and 18:54:25 UT on 16 December 2015, roughly corresponding to the observation time of the ALMA interferometric image. To improve the quality of the image, 70 individual frames were stacked together and averaged. Applying this procedure meant that the final image was slightly sharpened.
2.4. SDO observations
We used the SDO-AIA data5 (Lemen et al. 2012) at 171 Å, 193 Å, 304 Å, and 1700 Å, taken at 20:12 UT on 18 December 2015 and 18:32 UT on 16 December 2015. The spatial resolution is 0.6″ per pixel in all images. We also used the SDO Helioseismic and Magnetic Imager (HMI) data (Scherrer et al. 2012), which were taken at the same times with the spatial resolution of 0.5″ per pixel. In order to better characterize different features observed with ALMA, their temporal evolution and dynamics in the HMI and AIA channels were analyzed using JHelioviewer visualization software (Müller et al. 2017). The primary ions, regions of the atmosphere and characteristic temperatures observed by AIA channels used herein are listed in Table 1. These selected channels map layers of the solar atmosphere of increasing height and have high count rates in the quiet Sun and active regions (O’Dwyer et al. 2010).
SDO/AIA channels, adapted from Lemen et al. (2012).
2.5. GOES observations
The Geosynchronous Operational Environmental Satellite 13 (GOES-13) Solar X-ray Imager (SXI) data6 were taken through the tin (Sn) filter with a wavelength range of 6–78 Å and a spatial resolution of 5″ per pixel. The image was recorded at 20:12 UT on 18 December 2015.
3. Results
3.1. Quiet Sun region; single-dish ALMA
Small-scale, bright ALMA features in the quiet region of the Sun observed by the ALMA, SDO-HMI and AIA, and GOES-SXI, instruments are shown in Fig. 1. The quiet region of the Sun is denoted by the white rectangle in the full-disk ALMA image in Fig. 1a.
The four bright features marked by numbers in the lower left part of the selected quiet Sun region shown in Fig. 1c are compared with a corresponding magnetogram, EUV, and soft X-ray images in panels d, e, and f, respectively.
It can be seen that ALMA bright features correspond very well with the most prominent magnetogram features. The features marked with 1, 2, 3, and 4 are all bipolar (or rather multipolar), and they also appear bright in coronal emissions. Feature 1, as the most probable case for CBP, is analyzed in detail in the bottom panels of Fig. 1(g, h, i, and j). This feature lies over a large bipolar magnetic structure with an additional smaller patch of negative flux to the north-east. Emission in EUV shows several bright loops covering the region in the direction of the underlying magnetic flux. Similarly, an enhanced emission is also visible in soft X-rays, but it is slightly less compact, probably due to the lower image resolution. We can conclude that feature 1 is a CBP. Features 2 and 3 are less clear. Feature 2 is located above a complex bipolar region, but it only appears as a bright diffuse region in EUV and soft X-rays, without any obvious structure. A small loop is visible to the north in 193 Å, right above the magnetic bipole. The X-ray emission from CBPs is emitted from the CBP loop tops, while the loop footpoints are seen in transition region temperatures. Feature 3 also lies over the complex bipolar region, but EUV emission only shows a small loop connecting a few magnetic flux concentrations of the opposite polarity. Again, in soft X-rays, two enhancements are barely visible, roughly corresponding to the footpoints of the loop. In conclusion, features 2 and 3 both also seem to be CBPs, but not as definitively as feature 1. Finally, feature 4 is not as bright as the previous three features in the ALMA image, but it shows significant emission in both EUV and soft X-rays. In the AIA 193 Å channel, a bright loop is visible arching over the locations of opposite polarity magnetic concentrations. It is most probably another case of CBP. Other small-scale bright ALMA features are mostly associated with unipolar magnetic field and are invisible in coronal emissions. They are most likely related to solar plages or magnetic network elements.
3.2. Active region; interferometric mosaic ALMA
3.2.1. A comparison of small-scale ALMA bright features with structures at other wavelengths
We began by identifying the small-scale bright features in the ALMA image and checking their correspondence in images at other wavelengths. A high-resolution interferometric ALMA image of the active region 12470 is presented in Fig. 2 together with the Hα core and red and blue wing sum images from NSO-SOLIS-FDP and four SDO images in 171 Å, 193 Å, 304 Å, and 1700 Å, as indicated in the figure. We note that the beam size is almost an order of magnitude (7.3 times) smaller for the interferometric measurements than for the single-dish measurements. In Fig. 2a, several small-scale ALMA bright features were identified and denoted with squares. Smaller features are framed with smaller, blue squares, while larger features, showing different forms, lie within larger, red squares. All squares are enumerated and are located at the same positions in all other panels of Fig. 2.
We compared visibility and shape of small-scale ALMA bright features with counterparts in other wavelength ranges. The results of this visual inspection are listed in Table 2. In the second column, titled ALMA, we describe the shape of the ALMA bright feature for 14 selected areas. In the third column (HMI), we describe the characteristics of the line-of-sight (LOS) magnetic field, where “complex” refers to shape and “neutral” denotes a very weak LOS magnetic field. While the magnetic polarity is taken from the HMI single frame, the dynamical evolution of magnetic structures is analyzed using multiple HMI frames in JHelioviewer, and the information obtained this way complements the characterization in the third column. In the fourth and fifth columns, we analyze if the shape of the feature in the Hα line matches that seen in ALMA and if the feature is dark or bright. In the sixth column, we look for matching shapes in SDO 1700 Å and ALMA, while in the next three columns, we list the visibility of the ALMA feature in SDO 304 Å, 171 Å, and 193 Å channels. The three SDO columns are sorted in ascending height order according to Table 1. In the last column, we provide the most plausible type of the solar feature based on the observations at other wavelengths.
The LOS magnetic field varies in shape and polarity in the selected areas, indicating that the observed features are not of the same type. A correlation between ALMA and the Hα core exists, but it is far from unambiguous. Most bright ALMA features correspond to dark and sometimes bright Hα areas with a weak or good shape match. In the Hα wing (the sum of the blue and red wings of Hα), the correlation is better, and the majority of ALMA bright features correspond to dark areas. A comparison of SDO 1700 Å and ALMA images in general shows weak correlation. Shape matching is very good in some cases, but for others it is nonexistent. In the SDO 304 Å channel, we were able to identify all but one ALMA feature (ID = 12), while in 171 Å images, identification proved more difficult. This is the case for the 193 Å image, and about 50% of features are barely visible, if at all. The analysis of 304 Å, 171 Å, and 193 Å SDO channels shows that the visibility systematically drops with increasing height and characteristic temperature (Table 1).
In Figs. 3a–d, we show four regions of interest from Fig. 2 in more detail and compare them with SDO-HMI, Hα core, and SDO-AIA 304 Å and 193 Å zoomed-in images. The ALMA contours are overlaid over all other images. In general, ALMA bright features are concentrated around strong LOS magnetic fields. Correlation with the SDO 304 Å channel is very good, while it is worse in 193 Å, but still not bad. Again, one notable exception is Fig. 3c (ID = 11), where ALMA is also bright in areas in which the corresponding SDO-AIA images are not. The detailed analysis of these four small-scale bright ALMA features is also taken into account to resolve some ambiguous cases in Table 2.
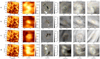 |
Fig. 3. Several selected ALMA regions, indicated by white rectangles in the first column images, shown enlarged in subsequent images at various wavelenghts: ALMA 3.0 mm, SDO-HMI magnetogram, SOLIS-FDP Hα core 6563 Å, SDO-AIA 304 and 193 Å, respectively. ALMA contours are overlaid in each image. Contour levels are at 9000, 9500, 9750, 10 000, 10 250 and 10 500 K. IDs of selected regions are given in the first column. |
3.2.2. A comparison of identified Hα structures with ALMA counterparts
To further investigate a complex relationship between the ALMA and Hα images of an active region, we searched for the ALMA counterparts of the known and identified Hα structures. So, Fig. 4 shows a comparison between the Hα core image and the ALMA interferometric image of the active region with Hα core contours overlaid (upper panels). We then repeated the procedure using the Hα wing sum image (lower panels). In the Hα image, we analyze the most prominent dark areas (a sunspot and two small elongated filaments) and bright areas (four plages) in detail. These include the following: (i) the sunspot S located at x = [−490″, −460″], y = [200″,240″], which appears dark in Hα as well as at 3 mm (within the umbra, however, there is a local enhancement of the 3 mm radiation clearly visible in the ALMA image, without a notable Hα counterpart); (ii) two small, dark Hα filaments are visible to the left (FIL1) and to the right (FIL2) of the sunspot S at x1 = [−560″, −520″], y1 = [160″,190″] and x2 = [−420″, −370″], y2 = [180″,200″]. They are also clearly visible as dark structures in the 3 mm ALMA image; (iii) four bright plage areas, P1, P2, P3, and P4, are located at x1 = [−450″, −270″], y1 = [290″,360″]; x2 = [−580″, −500″], y2 = [200″,250″]; x3 = [−350″, −310″], y3 = [170″,230″]; x4 = [−330″, −270″], and y4 = [80″,130″]. All of them also appear bright in the ALMA image at 3 mm, as expected.
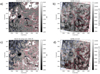 |
Fig. 4. Comparison between (a) the Hα core image and (b): the ALMA image with Hα core contours overlaid, (c) the Hα wing sum image, and (d) the ALMA image with Hα wing sum contours overlaid. Blue, white, and red contours are in increasing intensity order. In panel a “P” denotes the four plages, “S” the sunspot, and “FIL” the two small filaments. |
The Hα wing sum image is more fragmented in comparison with the Hα core image. The general appearance in ALMA is partly similar to the Hα core, and the qualitative correspondence (bright-bright, dark-dark) can be seen in some cases. However, there are also some opposite examples, where dark areas in the Hα wing sum correspond to bright areas in ALMA.
4. Discussion
4.1. Quiet Sun region and single-dish ALMA
Enhanced quiet Sun emission seen in ALMA is almost always associated with a strong LOS magnetic field. Moreover, enhanced ALMA emission in the single-dish ALMA image (Fig. 1) follows the magnetic network very well, which can be seen from the good match between ALMA images, HMI magnetograms, SDO-AIA 193 Å channel images, and soft X-ray GOES images. We selected a region of interest in the full-disk ALMA image, and within it we identified four possible cases of CBPs, while other small-scale ALMA bright features are most likely magnetic network elements and plages. One CBP from the quiet Sun visible in the ALMA image is analyzed in detail. Its elongated body clearly lies over a bipolar magnetic region in the photosphere (SDO-HMI magnetogram) and is strongly correlated with the CBP visible in emission in EUV 193 Å and in soft X-rays.
4.2. Active region and interferometric mosaic ALMA
4.2.1. A comparison of small-scale ALMA bright features with structures at other wavelengths
The high-resolution ALMA image of an active region (Fig. 2) reveals many small-scale bright features around the sunspot. We analyzed ten smaller, mostly point-like structures and four larger, extended structures in more detail. Generally speaking, small-scale bright ALMA features are almost always associated with a strong LOS magnetic field in HMI images, frequently preserving the shape visible in ALMA.
Images taken in SDO-AIA 304 Å, 171 Å, and 193 Å show decreasingly lower correlation with ALMA bright features, as these channels are sensitive to increasing heights and temperatures (Table 1). The cause is probably linked to large magnetic loops overlying the active region (Fig. 2h). As the loops become more visible and brighter, the contrast against lower lying features is lost, and bright, lower lying features are blended with the radiation coming from the large loops in EUV.
Using data from Table 2, which were composed by carefully inspecting Figs. 2 and 3 and by checking the magnetic evolution of the structures on many subsequent frames using JHelioviewer, we can designate the most probable type of all of the14 identified small-scale bright ALMA features.
Four cases are obviously CBPs (ID = 6, ID = 8, ID = 10, ID = 12) and one additional a possible candidate for the CBP (ID = 14). In all of these cases, the magnetic polarity is bipolar, with either emerging or canceling flux. In chromospheric and coronal lines, these features can be identified, with the characterization of “match” or “weak match”, except in one case (ID = 12), where bright, coronal, large-scale structures overlay the CBP.
There are two good plage candidates (ID = 2, ID = 7), which are magnetically unipolar and stable, and clearly bright in the Hα core. One further case is ambiguous: it is either a CBP or a plage (ID = 9). The magnetic structure is bipolar, but complex, the feature is clearly bright in the Hα core, and the correspondence with the chromospheric and coronal lines is good.
In the next subgroup, we have five possible fibril candidates (ID = 1, ID = 4, ID = 5, ID = 11, ID = 13). The magnetic structure is mostly unipolar and stable, except in one case (bipolar, stable, ID = 5). All of these structures appear dark in the Hα core.
Finally, we have one special case (ID = 3) in which the ambiguity is between a fibril and a jet. This structure is magnetically neutral and dark in the Hα core, exposing a weak match in SDO-AIA 304 Å, a streak in 171 Å, and no match in 193 Å.
The correlation between small-scale ALMA bright features and the Hα wing sum dark features is good (all cases except ID = 6, where the feature appears bright), although the shape is not completely preserved, which could be a consequence of lower resolution. Dark fibrils in the Hα wing might mark horizontal field lines connecting opposite magnetic polarities (Zirin 1988; Madjarska et al. 2021). This is in agreement with a high correlation of ALMA bright points and magnetic structures, although in some cases only one polarity could be related to the mm and Hα structure. We also note that fibrils might show significant magnetic evolution, as pointed out by Tandberg-Hanssen (1995) and described in more detail in the Introduction.
The distance between opposite magnetic polarities for feature ID = 6 is ≈8500 km. Assuming a semicircular shape of the loop, we can estimate the height to be ≈4000 km. This places the feature in the lower corona, supporting the idea that the object is a CBP, even though this height is lower than that typically found in other CBP studies (Brajša et al. 2004; Sudar et al. 2016). Shimojo et al. (2017b) also detected a CBP in close proximity to a sunspot. We also note that this feature appears bright in the Hα wing sum, although in all other cases CBPs appear dark in the Hα wing sum. Using high-resolution EUV and Hα images, Madjarska et al. (2021) recently studied the chromospheric counterpart of the CBP and found that it is composed of a bundle of dark elongated features called Hα loops. The footpoints of these Hα loops are rooted in the magnetic flux concentrations of opposite polarity and appear as bright features in Hα. The brightenings have sharp edges in the line wings, while they appear larger and more diffuse at the edges in the line center.
Based on the characteristics of small-scale bright ALMA features summarized in Table 2, we now present joint statistics of the distribution of various properties found, with the number of cases in parenthesis. We note that there are always 14 structures in total. According to the shape in ALMA we found: multiple points (3), complex (7), and point-like structures (4). Regarding the magnetic polarity according to HMI we found: unipolar (6), bipolar (7), and neutral (1). Regarding the magnetic structure according to JHelioviewer we found: stable (6), canceling flux (5), emerging flux (2), and N/A (1)7. According to the visibility in the Hα core we identified: dark (9): match (5) and weak match (4); bright (4): match (1) and weak match (3); no match (1). According to the visibility in the Hα wing sum we identified: dark (13): match (8) and weak match (5); bright (1): weak match (1). Furthermore, regarding the visibility in SDO-AIA 1700 Å we found: match (7), weak match (2), and no match (5). Regarding the visibility in SDO-AIA 304 Å we found: match (8), weak match (5), and no match (1). According to the visibility in SDO-AIA 171 Å we found: match (5), weak match (5), streak (1), and no match (3). According to the visibility in SDO-AIA 193 Å we found: match (1), weak match (7), and no match (6). Finally, regarding the type of structures we concluded: CBP (5), plage (2), fibril (5), jet? or fibril? (1), and CBP? or plage? (1).
4.2.2. A comparison of identified Hα structures with ALMA counterparts
A comparison between the Hα core image and the interferometric 3 mm ALMA image of the analyzed active region with contours of Hα overlaid over the ALMA image (Fig. 4) reveals a good correspondence. The sunspot S appears dark in both images (with a local ALMA radiation enhancement in the sunspot umbra), the four plage areas, P1, P2, P3, and P4, appear bright in both images, and the two dark Hα filaments (FIL1 and FIL2) are also clearly recognized as dark structures of the same shape in ALMA. It is interesting that while FIL1 lies along the magnetic inversion line, as can be seen in the LOS magnetogram (Fig. 2), FIL2 is not associated with any discernible LOS magnetic structure. We also checked the evolution of the FIL2 in a series of Hα images from the Solar Monitor8, eight hours earlier and 15 hours later than the time of the ALMA image. The small filament FIL2 shows a clear development growing in size during the 24-hour period under consideration.
A comparison between the Hα wing sum image and the interferometric 3 mm ALMA image of the analyzed active region with contours of Hα overlaid over the ALMA image (Fig. 4d) reveals a more complicated relationship than for the Hα core case. The sunspot is also dark in the Hα wing sum image, as expected. Both filaments are dark in all three images: Hα core, Hα wing sum, and ALMA. The plage areas P1 and P2 are bright in all three images: Hα core, Hα wing sum, and ALMA. However, the plage area P3 is bright in the Hα core, dark in the Hα wing sum, and bright in ALMA. Furthermore, the plage area P4 has a less defined bright shape in the Hα core, corresponding to a less defined shape (partly bright and partly dark) in the Hα wing sum, while the ALMA shape corresponds to the brightness-inverted wing sum shape. Finally, many small-scale structures that are bright in the Hα wing sum are dark in ALMA and vice-versa. At present, we do not have a satisfactory explanation for this curious relationship between the Hα wing sum and ALMA images, but we note that the most significant difference in comparison to the Hα core image appears in the case of plages P3 and P4.
5. Summary
In this work, we analyzed small-scale ALMA bright features in the quiet Sun region using single-dish ALMA observations (1.21 mm, 248 GHz) and in an active region using interferometric ALMA measurements (3 mm, 100 GHz). Using single-dish observations, a full-disk solar image was produced, while interferometric measurements enable the high-resolution reconstruction of a part of the solar disk, including an active region. The selected quiet Sun region was compared with the SDO-HMI magnetogram, with the SDO-AIA 193 Å image, and with the soft X-ray GOES image. The ALMA image of the selected active region was compared with a series of other images: SDO-HMI magnetogram, Hα core and wing sum, SDO-AIA 1700 Å, 304 Å, 171 Å, and 193 Å. The dynamics of the magnetic structure was inspected by SDO-HMI videos from JHelioviewer, and the quality and resolution of the Hα images were improved using the stacking procedure. The results are summarized in Table 2, where the visibility of the selected small-scale ALMA bright features is checked in other images. Finally, we also compared the ALMA image of the active region with the corresponding Hα core and wing sum images, using contour overlapping, to check the ALMA correspondence of various known chromospheric structures visible in the Hα images of the Sun.
Based on the analysis and results presented in this work, we can conclude that in the quiet Sun region, enhanced emission seen in ALMA is almost always associated with a strong LOS magnetic field. In the selected quiet Sun region, four good chromospheric correspondences for CBPs were identified, while other small-scale ALMA bright features are most likely associated with magnetic network elements and plages.
In the active region 14 small-scale ALMA bright features were randomly selected, compared with other images, and analyzed in detail. For CBPs, we found five good candidates. In all of these cases, the magnetic polarity is bipolar, with either emerging or canceling flux. Except in one case, there is a good correspondence with structures in chromospheric and coronal lines. In four cases, we found a good correspondence with Hα wing sum dark features, and in one case with a bright feature. It is interesting to note that Madjarska et al. (2021) identified the chromospheric counterpart of the CBPs as dark elongated features called Hα loops, which correspond to dark Hα fibrils, but the footpoints of these Hα loops are rooted in the magnetic flux concentrations of opposite polarity and appear as bright features in Hα. There are two good candidates for plages, which are magnetically unipolar and stable and clearly bright in the Hα core. One further case is ambiguous: it is either a CBP or a plage. We found five possible fibril candidates. Their magnetic structure is mostly unipolar and stable, except in one case where it is bipolar. All of these structures appear dark in the Hα core. We note that the identification of fibrils as small-scale bright ALMA features is less certain than in case of CBPs. Finally, there are two unclear cases. In the first, it is unclear if the ALMA feature is a fibril or a jet. The structure is magnetically neutral, dark in Hα core, and hidden by loop-like streaks in upper transition region and coronal lines. In the second ambiguous case, it remains unclear if the ALMA feature is a CBP or a plage. The magnetic structure is bipolar, but complex, the feature is clearly bright in the Hα core, and the correspondence with the chromospheric and coronal lines is good. The correlation between small-scale ALMA bright features and Hα wing sum dark features is very high, as it was confirmed in all but one case. Dark fibrils in the Hα wing might mark horizontal field lines connecting opposite magnetic polarities (Zirin 1988; Madjarska et al. 2021), but the fibrils might also show significant dynamics and magnetic evolution, as pointed out by Tandberg-Hanssen (1995).
A comparison of the Hα core image and the ALMA image of the analyzed active region with contours of Hα overlaid over the ALMA image showed that the sunspot appears dark in both images (with a local ALMA radiation enhancement in sunspot umbra), the four plage areas bright in both images, and small dark Hα filaments, are also clearly recognized as dark structures of the same shape in ALMA. Finally, a comparison of the Hα wing sum image and the ALMA image of the analyzed active region shows a similar behavior to that of the Hα core case, with the exception that two plage areas are completely or partly dark in the Hα wing sum image. Moreover, many small-scale structures, which are bright in the Hα wing sum, are dark in ALMA and vice-versa, implying a bright-dark and dark-bright correlation.
6. Conclusions
For the first time, a correspondence between small-scale ALMA bright features and various chromospheric and coronal structures, CBPs, plages, fibrils, and jets, was found. Most of the ALMA structures originate in the chromosphere coupled with regions of strong photospheric magnetic field. Some smaller structures with higher temperatures might be at higher altitudes, that is in the transition region.
We note that a generally good one-to-one correspondence of the structure’s positions and shapes in the ALMA image with other images was found. This confirms that the reconstruction of the ALMA interferometric image and the overlay of various images (orientation, co-alignment) has been done accurately and reliably and also demonstrates that ALMA features are real and not image synthesis artifacts. We conclude that small-scale bright ALMA features with soft X-ray enhancements in the quiet Sun region trace the locations of CBPs and the underlying magnetic network.
A general conclusion for the active region is that ALMA small-scale bright structures follow magnetic structures from SDO-HMI and SDO-AIA 1700 Å and 304 Å bright features rather well. This leads to the conclusion that bulk of the millimeter radiation originates from the chromosphere and transition region (Table 1) and from the structures above areas of the increased photospheric magnetic field, as can be seen in the SDO-HMI images. This is in agreement with the fact that the ALMA Band 3 originates from higher chromospheric levels, and the ALMA Band 6 originates from lower ones. Some small-scale ALMA structures are also discernible in the SDO-AIA 171 Å and 193 Å channels. Lower chromospheric structures can be partly seen with ALMA through the optically thin corona, whereas SDO-AIA 193 Å loops are not visible.
The identification of small-scale ALMA bright features in active regions as EUV CBPs might be complicated in some cases. The cause is probably the appearance of large bright magnetic loops overlying the active region and in this way the contrast against lower lying features is lost, and bright, lower lying features are blended with the radiation coming from the large loops in EUV.
Rutten (2017) predicted that the general appearance of the solar chromosphere at the ALMA wavelengths will be similar to the Hα core images with a good dark-dark correspondence. A good dark-dark correspondence (sunspot and small filaments) and bright-bright correspondence (plages) between the two images was found by the present analysis. However, the relationship between Hα core and high-resolution ALMA images in the millimeter wavelength range is more complicated, since we find examples of both types of behavior: some small-scale, bright ALMA features have bright counterparts, and some have dark Hα counterparts. Moreover, we also found examples of a bright-dark and a dark-bright correlation between the Hα wing sum and ALMA images.
Finally, a local enhancement of 3 mm ALMA radiation is visible within the sunspot umbra, confirming an earlier analysis of the same active region by Iwai et al. (2017). This umbral brightening observed with ALMA can also be recognized in the SDO-AIA 304 Å and 171 Å channels, indicating a transition region height.
Increased ALMA brightness suggests a higher temperature in the emission region where the magnetic field is strong. Because of the high correspondence of ALMA bright features with magnetic flux elements, future theoretical modeling of small-scale ALMA bright features should also include detailed magnetic structure. We note that a detailed magnetic topological analysis of CBPs was performed by Galsgaard et al. (2017). In the present analysis, we tried the usual potential field source surface (PFSS) model calculation for both the quiet Sun and active regions, but this did not render sufficient new information, because the spatial resolution of the procedure we used was too low. So, we leave this type of analysis to be done in more detail in a later work. A better constraint on the height range of the observed structures will be possible using a tomographic method when additional observing frequencies (ALMA observing bands) become available. This is also left for future research.
This one case refers to the neutral magnetic polarity feature, in which no structure and dynamics could be determined.
Acknowledgments
This work has been supported by the Croatian Science Foundation under the project 7549 “Millimeter and submillimeter observations of the solar chromosphere with ALMA”. It has also received funding from the Horizon 2020 project SOLARNET (824135, 2019–2022). In this paper ALMA data ADS/JAO.ALMA#2011.0.00020.SV were used. ALMA is a partnership of ESO (representing its member states), NSF (USA) and NINS (Japan), together with NRC (Canada), MOST and ASIAA (Taiwan), and KASI (Republic of Korea), in cooperation with the Republic of Chile. The Joint ALMA Observatory is operated by ESO, AUI/NRAO and NAOJ. We are grateful to the ALMA project for making solar observing with ALMA possible. SDO is the first mission launched for NASA’s Living With a Star (LWS) Program. This work utilizes data obtained by the Global Oscillation Network Group (GONG) Program, managed by the National Solar Observatory (NSO), which is operated by AURA, Inc. under a cooperative agreement with the National Science Foundation (NSF). The data were acquired by instruments operated by the Big Bear Solar Observatory, High Altitude Observatory, Learmonth Solar Observatory, Udaipur Solar Observatory, Instituto de Astrofisica de Canarias, and Cerro Tololo Interamerican Observatory. This work utilizes SOLIS data obtained by the NSO Integrated Synoptic Program (NISP), managed by the National Solar Observatory (NSO), which is operated by the Association of Universities for Research in Astronomy (AURA), Inc. under a cooperative agreement with the National Science Foundation (NSF). R. B. acknowledges financial support from the Alexander von Humboldt Foundation. H. G. L. acknowledges financial support by the Sonderforschungsbereich SFB 881 “The Milky Way System” (subprojects A4) of the German Research Foundation (DFG). C. L. S. acknowledges financial support from the São Paulo Research Foundation (FAPESP), grant number 2019/03301-8. We thank Manuela Temmer and Bojan Vršnak for helpful remarks and discussion. Finally, we thank the anonymous referee for insightful comments and suggestions which led to the significantly improved paper.
References
- Aschwanden, M. J. 2019, New Millennium Solar Physics, 458 [CrossRef] [Google Scholar]
- Bastian, T. S., Bárta, M., Brajša, R., et al. 2018, Messenger, 171, 25 [Google Scholar]
- Borrero, J. M., Jafarzadeh, S., Schüssler, M., & Solanki, S. K. 2017, Space Sci. Rev., 210, 275 [NASA ADS] [CrossRef] [Google Scholar]
- Brajša, R., Wöhl, H., Vršnak, B., et al. 2001, A&A, 374, 309 [NASA ADS] [CrossRef] [EDP Sciences] [Google Scholar]
- Brajša, R., Wöhl, H., Vršnak, B., et al. 2002, A&A, 392, 329 [NASA ADS] [CrossRef] [EDP Sciences] [Google Scholar]
- Brajša, R., Wöhl, H., Vršnak, B., et al. 2004, A&A, 414, 707 [NASA ADS] [CrossRef] [EDP Sciences] [Google Scholar]
- Brajša, R., Wöhl, H., Vršnak, B., et al. 2008, Cent. Eur. Astrophys. Bull., 32, 165 [Google Scholar]
- Brajša, R., Sudar, D., Skokić, I., Saar, S. H., & Žic, T. 2015, Cent. Eur. Astrophys. Bull., 39, 21 [Google Scholar]
- Brajša, R., Kuhar, M., Benz, A. O., et al. 2018a, Cent. Eur. Astrophys. Bull., 42, 1 [Google Scholar]
- Brajša, R., Sudar, D., Benz, A. O., et al. 2018b, A&A, 613, A17 [NASA ADS] [CrossRef] [EDP Sciences] [Google Scholar]
- Gabriel, A. 1992, in NATO Advanced Science Institutes (ASI) Series C, eds. J. T. Schmelz, & J. C. Brown, 373, 277 [Google Scholar]
- Galsgaard, K., Madjarska, M. S., Moreno-Insertis, F., Huang, Z., & Wiegelmann, T. 2017, A&A, 606, A46 [NASA ADS] [CrossRef] [EDP Sciences] [Google Scholar]
- Golub, L., & Pasachoff, J. M. 1997, The Solar Corona (Cambridge, UK: Cambridge University Press), 388 [Google Scholar]
- Gurman, J. B. 1992, in NATO Advanced Science Institutes (ASI) Series C, eds. J. T. Schmelz, & J. C. Brown, 373, 245 [Google Scholar]
- Habbal, S. R., & Harvey, K. L. 1988, ApJ, 326, 988 [NASA ADS] [CrossRef] [Google Scholar]
- Habbal, S. R., Ronan, R. S., Withbroe, G. L., Shevgaonkar, R. K., & Kundu, M. R. 1986, ApJ, 306, 740 [Google Scholar]
- Harvey, K. L. 1985, Aust. J. Phys., 38, 875 [NASA ADS] [CrossRef] [Google Scholar]
- Iwai, K., Loukitcheva, M., Shimojo, M., Solanki, S. K., & White, S. M. 2017, ApJ, 841, L20 [Google Scholar]
- Keller, C. U., Harvey, J. W., & Giampapa, M. S. 2003, in Innovative Telescopes and Instrumentation for Solar Astrophysics, eds. S. L. Keil, & S. V. Avakyan, SPIE Conf. Ser., 4853, 194 [NASA ADS] [CrossRef] [Google Scholar]
- Kwon, R.-Y., Chae, J., & Zhang, J. 2010, ApJ, 714, 130 [NASA ADS] [CrossRef] [Google Scholar]
- Kwon, R.-Y., Chae, J., Davila, J. M., et al. 2012, ApJ, 757, 167 [Google Scholar]
- Lemen, J. R., Title, A. M., Akin, D. J., et al. 2012, Sol. Phys., 275, 17 [Google Scholar]
- Loukitcheva, M. 2019, Adv. Space Res., 63, 1396 [Google Scholar]
- Madjarska, M. S. 2019, Liv. Rev. Sol. Phys., 16, 2 [Google Scholar]
- Madjarska, M. S., Chae, J., Moreno-Insertis, F., et al. 2021, A&A, 646, A107 [EDP Sciences] [Google Scholar]
- Martres, M. J., & Bruzek, A. 1977, in Illustrated Glossary for Solar and Solar-Terrestrial Physics, eds. A. Bruzek, & C. J. Durrant, Astrophys. Space Sci. Lib., 69, 53 [Google Scholar]
- Mou, C., Huang, Z., Xia, L., et al. 2016, ApJ, 818, 9 [NASA ADS] [CrossRef] [Google Scholar]
- Mou, C., Madjarska, M. S., Galsgaard, K., & Xia, L. 2018, A&A, 619, A55 [NASA ADS] [CrossRef] [EDP Sciences] [Google Scholar]
- Müller, D., Nicula, B., Felix, S., et al. 2017, A&A, 606, A10 [NASA ADS] [CrossRef] [EDP Sciences] [Google Scholar]
- Nitta, N. V., Sun, X., Hoeksema, J. T., & DeRosa, M. L. 2014, ApJ, 780, L23 [NASA ADS] [CrossRef] [Google Scholar]
- O’Dwyer, B., Del Zanna, G., Mason, H. E., Weber, M. A., & Tripathi, D. 2010, A&A, 521, A21 [NASA ADS] [CrossRef] [EDP Sciences] [Google Scholar]
- Phillips, N., Hills, R., Bastian, T., et al. 2015, in Revolution in Astronomy with ALMA: The Third Year, eds. D. Iono, K. Tatematsu, A. Wootten, L. Testi, et al., ASP Conf. Ser., 499, 347 [Google Scholar]
- Rodger, A. S., Labrosse, N., Wedemeyer, S., et al. 2019, ApJ, 875, 163 [NASA ADS] [CrossRef] [Google Scholar]
- Rutten, R. J. 2017, A&A, 598, A89 [NASA ADS] [CrossRef] [EDP Sciences] [Google Scholar]
- Rutten, R. J., & Rouppe van der Voort, L. H. M. 2017, A&A, 597, A138 [NASA ADS] [CrossRef] [EDP Sciences] [Google Scholar]
- Scherrer, P. H., Schou, J., Bush, R. I., et al. 2012, Sol. Phys., 275, 207 [Google Scholar]
- Selhorst, C. L., Simões, P. J. A., Oliveira e Silva, A. J., et al. 2017, ApJ, 851, 146 [Google Scholar]
- Shimojo, M., Bastian, T., Hales, A., et al. 2017a, Sol. Phys., 292, 87 [Google Scholar]
- Shimojo, M., Hudson, H. S., White, S. M., Bastian, T. S., & Iwai, K. 2017b, ApJ, 841, L5 [NASA ADS] [CrossRef] [Google Scholar]
- Skokić, I., Sudar, D., Saar, S. H., Brajša, R., & Poljančić-Beljan, I. 2016, Cent. Eur. Astrophys. Bull., 40, 23 [Google Scholar]
- Skokić, I., Brajša, R., Sudar, D., Ruždjak, D., & Saar, S. H. 2019, ApJ, 877, 142 [CrossRef] [Google Scholar]
- Solanki, S. K. 1993, Space Sci. Rev., 63, 1 [NASA ADS] [CrossRef] [Google Scholar]
- Solanki, S. K. 2004, in The Sun and the Heliosphere as an Integrated System, eds. G. Poletto, & S. T. Suess, Astrophys. Space Sci. Lib., 317, 373 [Google Scholar]
- Sudar, D., Skokić, I., Brajša, R., & Saar, S. H. 2015, A&A, 575, A63 [NASA ADS] [CrossRef] [EDP Sciences] [Google Scholar]
- Sudar, D., Saar, S. H., Skokić, I., Poljančić Beljan, I., & Brajša, R. 2016, A&A, 587, A29 [EDP Sciences] [Google Scholar]
- Tandberg-Hanssen, E. 1995, in The Nature of Solar Prominences, Astrophys. Space Sci. Lib., 199 [Google Scholar]
- von Rekowski, B., Parnell, C. E., & Priest, E. R. 2006, MNRAS, 366, 125 [Google Scholar]
- Wedemeyer, S., Bastian, T., Brajša, R., et al. 2016, Space Sci. Rev., 198, 1 [Google Scholar]
- White, S. M., Iwai, K., Phillips, N., et al. 2017, Sol. Phys., 292, 88 [NASA ADS] [CrossRef] [Google Scholar]
- Wöhl, H., Brajša, R., Hanslmeier, A., & Gissot, S. F. 2010, A&A, 520, A29 [NASA ADS] [CrossRef] [EDP Sciences] [Google Scholar]
- Zirin, H. 1988, Astrophysics of the Sun (Cambridge and New York: Cambridge University Press), 440 [Google Scholar]
- Zirin, H. 1992, in NATO Advanced Science Institutes (ASI) Series C, eds. J. T. Schmelz, & J. C. Brown, 373, 175 [Google Scholar]
All Tables
All Figures
|
Fig. 1. Panel a: single-dish ALMA 248 GHz (1.21 mm, Band 6). Panel b: SDO-HMI magnetogram, with white box outlining the quiet Sun area shown in middle row panels. Both images were taken on 18 December 2015 at 20:12 UT. Magnetogram intensity was clipped at ±120 Gauss and ALMA contours of 6500 K were overlaid in green. Panel c: ALMA image of the quiet Sun shown enlarged and compared with panel d: SDO-HMI magnetogram, panel e: SDO-AIA 193 Å filtergram, and panel f: GOES-13 SXI tin (Sn) filter image, with ALMA contours overlaid (levels at 6300, 6400, 6500, 6600, and 6700 K). Panels g–j: enlargements of a single ALMA bright feature, marked in the white rectangle in panel c, at the same wavelengths as in the middle row. The beam size of the single-dish ALMA measurements, 26″, is given in panel c. |
| In the text | |
|
Fig. 2. Panel a: interferometric image of the solar active region 12 470 obtained on 16 December 2015 at 100 GHz (3.0 mm) in ALMA Band 3. The calibrated ALMA image has a field of view of 300″ × 300″. The beam size of ALMA is 4.9″ × 2.2″. Panels b–h: images at other wavelengths taken close to the ALMA reference time (18:32 UT). Squares lie at the same positions in all images, denoting selected small-scale ALMA bright features. (a) ALMA 3.0 mm, 18:32:41 UT. (b) SDO/HMI LOS magnetogram, 18:33:45 UT. (c) FDP Hα core, 6563 Å, 18:28−18:54 UT. (d) FDP Hα wing, 6563 Å, 18:28−18:54 UT. (e) SDO/AIA 1700 Å, 18:32:54 UT. (f) SDO/AIA 304 Å, 18:32:42 UT. (g) SDO/AIA 171 Å, 18:32:34 UT. (h) SDO/AIA 193 Å, 18:32:42 UT. |
| In the text | |
|
Fig. 3. Several selected ALMA regions, indicated by white rectangles in the first column images, shown enlarged in subsequent images at various wavelenghts: ALMA 3.0 mm, SDO-HMI magnetogram, SOLIS-FDP Hα core 6563 Å, SDO-AIA 304 and 193 Å, respectively. ALMA contours are overlaid in each image. Contour levels are at 9000, 9500, 9750, 10 000, 10 250 and 10 500 K. IDs of selected regions are given in the first column. |
| In the text | |
|
Fig. 4. Comparison between (a) the Hα core image and (b): the ALMA image with Hα core contours overlaid, (c) the Hα wing sum image, and (d) the ALMA image with Hα wing sum contours overlaid. Blue, white, and red contours are in increasing intensity order. In panel a “P” denotes the four plages, “S” the sunspot, and “FIL” the two small filaments. |
| In the text | |
Current usage metrics show cumulative count of Article Views (full-text article views including HTML views, PDF and ePub downloads, according to the available data) and Abstracts Views on Vision4Press platform.
Data correspond to usage on the plateform after 2015. The current usage metrics is available 48-96 hours after online publication and is updated daily on week days.
Initial download of the metrics may take a while.