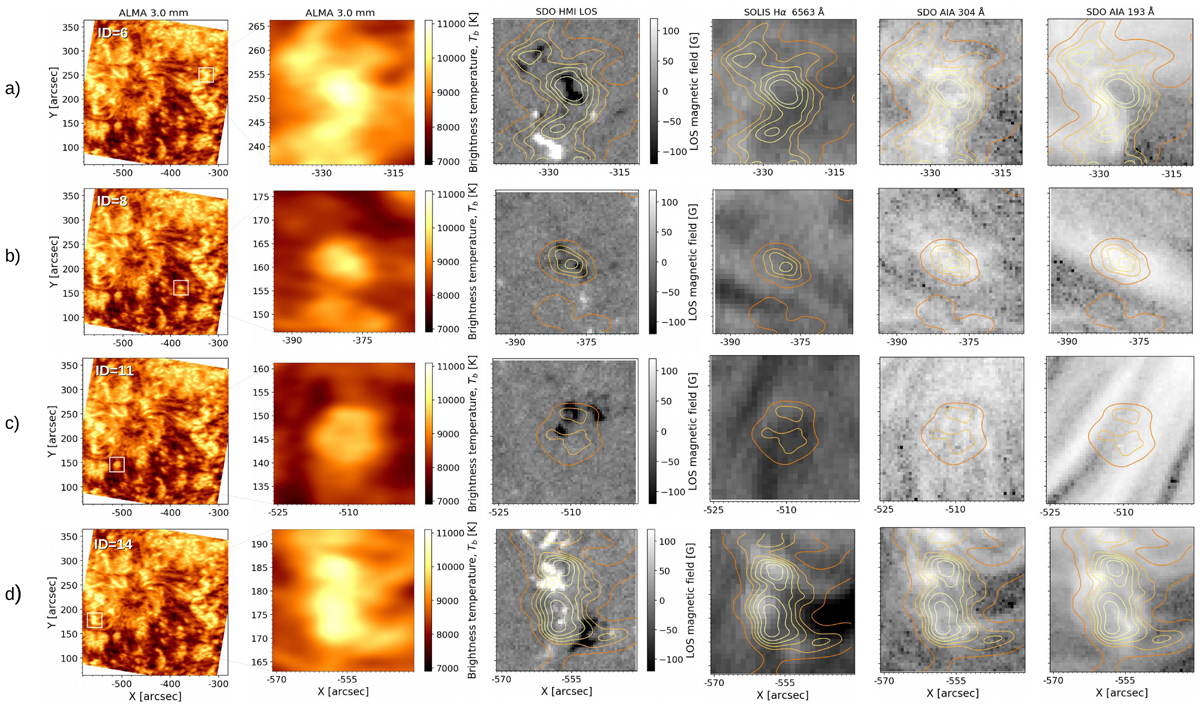
Fig. 3.

Several selected ALMA regions, indicated by white rectangles in the first column images, shown enlarged in subsequent images at various wavelenghts: ALMA 3.0 mm, SDO-HMI magnetogram, SOLIS-FDP Hα core 6563 Å, SDO-AIA 304 and 193 Å, respectively. ALMA contours are overlaid in each image. Contour levels are at 9000, 9500, 9750, 10 000, 10 250 and 10 500 K. IDs of selected regions are given in the first column.
Current usage metrics show cumulative count of Article Views (full-text article views including HTML views, PDF and ePub downloads, according to the available data) and Abstracts Views on Vision4Press platform.
Data correspond to usage on the plateform after 2015. The current usage metrics is available 48-96 hours after online publication and is updated daily on week days.
Initial download of the metrics may take a while.


