Fig. 5.
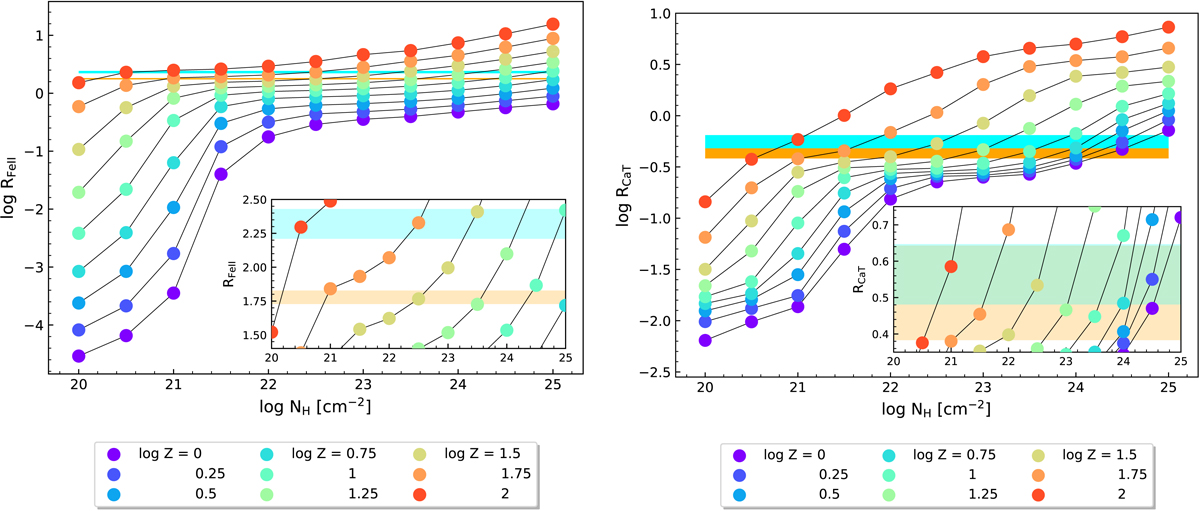
Left: strength of the optical Fe II emission (RFeII) shown with respect to the distribution in cloud column density (NH) from CLOUDY. The model uses a log U = −3.5 and log n = 11.75. The colours represent nine different cases of metallicity (Z). The observed estimates from Persson (1988) and Marinello et al. (2016) for I Zw 1 are shown in cyan and orange bars (the errors in these estimates are depicted by the widths of the bars), respectively. The inset plot zooms in on a portion of the base plot to highlight the modelled trends that recover the RFeII within the observed values. We note that the RFeII is shown in log scale in the base plot while for the inset plot we show the ratio in linear scale. Right: corresponding RCaT distribution for the same modelled parameters as in the previous panel.
Current usage metrics show cumulative count of Article Views (full-text article views including HTML views, PDF and ePub downloads, according to the available data) and Abstracts Views on Vision4Press platform.
Data correspond to usage on the plateform after 2015. The current usage metrics is available 48-96 hours after online publication and is updated daily on week days.
Initial download of the metrics may take a while.