| Issue |
A&A
Volume 650, June 2021
|
|
|---|---|---|
| Article Number | A130 | |
| Number of page(s) | 14 | |
| Section | Planets and planetary systems | |
| DOI | https://doi.org/10.1051/0004-6361/202040268 | |
| Published online | 17 June 2021 | |
Non-thermal escape on Triton driven by atmospheric and ionospheric chemistry
1
Planetary Environmental and Astrobiological Research Laboratory (PEARL), School of Atmospheric Sciences, Sun Yat-sen University,
Zhuhai,
Guangdong,
PR China
e-mail: This email address is being protected from spambots. You need JavaScript enabled to view it.
2
Key Laboratory of Lunar and Deep Space Exploration, Chinese Academy of Sciences,
Beijing,
PR China
3
Center for Excellence in Comparative Planetology, Chinese Academy of Sciences,
Hefei,
Anhui,
PR China
4
Institute of Space Science and Applied Technology, Harbin Institute of Technology,
Shenzhen,
Guangdong,
PR China
5
Institute of Geology and Geophysics, Chinese Academy of Sciences,
Beijing,
PR China
Received:
31
December
2020
Accepted:
6
March
2021
Abstract
Context. Jeans escape is believed to dominate atmospheric escape for most outer Solar System bodies. However, non-thermal mechanisms, particularly atmospheric and ionospheric chemistry, are likely to contribute substantially to neutral escape on Triton.
Aims. This study is devoted to evaluating the role of the chemically induced escape of H, H2, C, N, O, N2, and CO on Triton via a variety of processes. Here, we also aim to identify the dominant processes for these species.
Methods. We used the background atmospheric and ionospheric structures from available model calculations. We constructed a test particle Monte Carlo model to determine the escape probability profiles of various species released from 35 channels. Species-dependent and energy-dependent cross sections were adopted in our calculations, along with a strongly forward-scattering angle distribution, all constrained by the available laboratory measurements.
Results. The chemical escape rates on Triton are derived as 4.5 × 1024 s−1 for total H, 6.9 × 10²² s−1 for total C, 8.0 × 1024 s−1 for total N, and 1.4 × 10²³ s−1 for total O.
Conclusions. Based on a comparison with the respective Jeans escape rates, our calculations indicate that atmospheric and ionospheric chemistry make small but non-negligible contributions to both H and C escape on Triton, whereas its contributions to N and O escape are significant.
Key words: planets and satellites: atmospheres / planets and satellites: individual: Triton
© ESO 2021
1 Introduction
In the inner Solar System, atmospheric escape on planets, such as on our sister worlds Mars and Venus, tends to be dominated by non-thermal mechanisms in the form of both neutrals and ions (e.g. Johnson et al. 2008; Lammer et al. 2008; Dubinin et al. 2011; Lillis et al. 2015; Jakosky et al. 2018; Wu et al. 2019). On outer Solar System bodies, however, thermal escape is likely important. For instance, the thermally driven escape rates on Titan, the largest satellite of Saturn, were derived to be ~1028 s−1 for H2 (e.g. Cui et al. 2008, 2011), which is about five orders of magnitude higher than the photochemical escape rate (e.g. De La Haye et al. 2007). Likewise, atmospheric escape on Pluto, a Kuiper-belt object, is traditionally thought to be driven by hydrodynamical escape, in either the fast hydrodynamic regime or the high-density, slow-outflow regime (e.g. Hunten & Watson 1982; McNutt 1989; Krasnopolsky 1999; Tian & Toon 2005; Strobel 2008; Zhu et al. 2014). With the arrival of New Horizons in the vicinity of Pluto, atmospheric escape on this planetary body has been re-investigated and is now presumed to be dominated instead by Jeans escape, with the escape rates inferred to be 1 × 10²³ s−1 for N2 and 5 × 1025 s−1 for CH4 (Gladstone & Young 2019).
Atmospheric escape on Triton, the largest satellite of Neptune, is fascinating because of its thick and frigid N2 -dominated atmosphere. Based on the solar occultation observations made by the Voyager Ultraviolet Spectrometer (Broadfoot et al. 1989), the Jeans escape rate of atomic N on Triton was derived to be ~ 1025 s−1 (Krasnopolsky et al. 1993). The Jeans escape rates for other species, such as H, H2, C, and O, were also estimated based on photochemical model results. Specifically, the values for the Jeans parameter, λ, at Triton’s exobase are 0.75 and 1.5 for H and H2, corresponding to a total hydrogen (H+H2) escape rate of (7− 11) × 1025 s−1 (Strobel et al. 1990b; Krasnopolsky & Cruikshank 1995). The Jeans escape rates of C and O were estimated to be 1.1 × 1024 s−1 and 4.4 × 10²² s−1, respectively (Krasnopolsky & Cruikshank 1995). Despite existing efforts, few studies have focused on non-thermal escape from Triton’s atmosphere. In view of the rich plasma environment and the complicated photochemical network on Triton (e.g. Krasnopolsky & Cruikshank 1995; Sittler & Hartle 1996), atmospheric escape via non-thermal processes is likely to be occurring on Titan to a significant extent (e.g. Gu et al. 2019, 2020a).
In the present study, we evaluate, for the first time, the non-thermal escape rates of seven hot neutrals (H, H2, C, N, O, N2, and CO) driven by atmospheric and ionospheric chemistry on Triton, combining the test particle Monte Carlo approach and the model results of Krasnopolsky & Cruikshank (1995). This paper is divided into five sections. Section 2 presents the production rates of relevant hot neutrals in detail and in Sect. 3, we describe the Monte Carlo model used for obtaining the escape probabilities of various hot neutrals. In Sect. 4, we calculate the respective escape rates and compare the contributions from different channels. Finally, we present our discussion and concluding remarks in Sect. 5.
2 Hot neutral production rates
In order to determine the production rates of hot H, H2, C, N, O, N2, and CO in Triton’s atmosphere, we applied the model results of Krasnopolsky & Cruikshank (1995), which have been validated by the available Voyager Ultraviolet Spectrometer and radio occultation measurements (e.g. Broadfoot et al. 1989; Tyler et al. 1989; Krasnopolsky et al. 1993). We considered a wide variety of chemical reactions, including photon impact (PI) and (magnetospheric) electron impact (EI) processes, neutral-neutral, ion-neutral, and dissociative recombination (DR) reactions. Analogouslyto our previous study of Titan’s photochemical escape (Gu et al. 2020a), the kinetic energy release in each reaction was evaluated from the enthalpy difference between the reactants and products, both assumed to be in their ground states (Baulch et al. 2005). We also assumed that the energy partition between different products is inversely proportional to the molecular mass. In this study, we only considered those reactions that produce hotneutrals with kinetic energies exceeding their escape energies, including 6 PI and 2 EI processes, 13 neutral-neutral and 7 ion-neutral reactions, as well as 6 DR reactions, as listed in Table A.1.
For PI, the solar EUV intensities appropriate for the Voyager encounter with Triton are taken from Torr & Torr (1985), scaled by the heliocentric distance and interpolated to a 10.7 cm solar radio index of 200 solar flux units (sfu, i.e. 10−22 W m−2 Hz−1). Following Krasnopolsky & Cruikshank (1995), a background interstellar Lyman-alpha radiative flux of 4.1 × 10⁸ photons cm−2 s−1 (Lean 1991)is scaled by a factor of 1.28 to represent the flux in the 100–140 nm interval. The solar zenith angle adapted in this study is 60°, roughly representing the dayside mean state. For EI, the magnetospheric electron impact dissociation and ionisation rate profiles from Strobel et al. (1990b) are used, shifted upward by two scale heights according to Summers & Strobel (1991) and multiplied by a factor of 0.182 to reflect the orbitally averaged electron flux near Triton (Krasnopolsky et al. 1993; Krasnopolsky & Cruikshank 1995). For neutral–neutral, ion–neutral, and DR reactions, all rate coefficients are taken from Krasnopolsky & Cruikshank (1995) with an altitude-independent electron temperature of 100 K.
In Fig. 1, we display the background neutral atmosphere of Triton for the two most abundant species, N2 and N, over the altitude range of 0–1500 km. The density profiles below 1000 km are adapted from the recommended atmospheric model of Krasnopolsky et al. (1993), which are then extrapolated to higher altitudes assuming isothermal above 1000 km. The neutral temperature profile derived from the one-dimensional thermal conductivity model of Krasnopolsky et al. (1993) is also presented in the figure. Figure 2 shows the density profiles of various neutral reactants necessary for determining the hot neutral production rates at 0− 1000 km, including H, H2, C, O, CO, CH2 in panel (a); C2, CH, CH2, CH3, NH, CN, CNN, HCN in panel (b); and NO in panel (c). The density profiles in panel (a) are adapted from Krasnopolsky et al. (1993) and Krasnopolsky & Cruikshank (1995), whereas those in panel (b) are adapted from Krasnopolsky & Cruikshank (1995) below 300 km and extrapolated to 1000 km assuming diffusive equilibrium. Since the NO distribution is not available, itsdensity profile, as displayed in panel (c), is estimated from local chemical equilibrium below 300 km similar to the procedure used in our recent investigation of thermospheric NO on Mars (Cui et al. 2020), and its densities at higher altitudes are obtained assuming diffusive equilibrium.
According to Krasnopolsky & Cruikshank (1995), NO in Triton’s atmosphere is mainly produced via the radiative association reaction:
 (1)
(1)
and lost via its reaction with N:
 (2)
(2)
where T is the neutral temperature, and the rate coefficients are taken from Dalgarno et al. (1992) and Baulch et al. (1992). By balancing the chemical production and loss rates, the NO densities may be estimated via nNO ≈ (k1∕k2)nO with ni being the density of species i. The density profiles of electron and ion reactants used in this study are displayed in Fig. 3, all adapted from Krasnopolsky & Cruikshank (1995) and extrapolated to 1000 km assuming diffusive equilibrium. Figure 3 shows apparently that the dominant ion species in Triton’s ionosphere is HCO+ below ~ 220 km, while N+ and N tend to be more abundant above. It is worth noting that the electron density and total ion density are not identical in Figure 3, especially above 220 km, where C+ becomes themost abundant species of Triton’s ionosphere. This species is not shown in Fig. 3 because it is irrelevant tothe production of escaping neutrals (Krasnopolsky & Cruikshank 1995).
The hot neutral production rates are calculated from the atmospheric and ionospheric structures described above and displayed separately in Fig. 4 for the seven candidate escaping species. Specifically, we present the production rates of hot H and H2 in panel (a), and hot C, N, O,N2, and CO in panels (b) to (f), with the corresponding chemical channels listed in the figure legends and detailed information provided in Table A.1. For both the photolysis of CO and the DR reactions of CO+, N , and NO+, existing laboratory measurements have indicated that neutral fragments could be produced in different electronically excited states (e.g. McElroy & McConnell 1971; Peterson et al. 1998; Rosén et al. 1998; Hellberg et al. 2003). Here, different kinetic energy releases for different channels are fully accounted for in our calculations of the respective production rates.
Krasnopolsky (2021, personal communication) calculated the yields of electronic states and kinetic energies of products in most neutral–neutral reactions involved in this study (see Table A.1). The yields are assumed proportional to the statistical weights of electronic states, accounting for spin conservation, whereas the released reaction energy is assumed equally distributed between the vibrational, rotational, and translational (kinetic) degrees of freedom (DOFs) of the products. For illustrative purposes, we consider reaction (Rf 2) in Table A.1, which could produce hot N2 in either the ground  state or the excited
  state, where the latter is not able to escape due to the high excitation energy of 6.22 eV. By assuming that the populations of different N2 energy levels are proportional to the respective statistical weights (1 for
  and 3 for
  ), we may then conclude that reaction (Rf 2) has a 25% probability of producing N2 (
 ) and a 75%probability of producing N2 (
 ). For the same reaction, N2 as a product has six DOFs in either electronic state, including two rotational DOFs, one vibrational DOF, and three translational DOFs. Therefore, the released kinetic energies are 3.28 eV (= 6.55 eV∕6 × 3) for N2 (
 ) and 0.16 eV (= (6.55 − 6.22) eV∕6 × 3) for N2 (
 ), where 6.22 eV is the respective excitation energy. For each species, we are able to identify important production channels, which are addressed in detail below.
H: Important channels of H production below 130 km come from CH4 photodissociation:
 (3)
(3)
and two neutral–neutral reactions:
![Mathematical equation: \begin{equation*} \begin{array}{@{}l@{\ }lll} &\mathrm{ CH_4 + CH \rightarrow C_2H_4 + H} \qquad & (\mathrm{R_a3}),\\[4pt] &\mathrm{ NH + N \rightarrow N_2 + H} \qquad & (\mathrm{R_a4}). \end{array} \end{equation*}](/articles/aa/full_html/2021/06/aa40268-20/aa40268-20-eq14.png) (4)
(4)
The processes most efficient at producing hot H above 130 km are two ion-neutral reactions:
![Mathematical equation: \begin{equation*} \begin{array}{@{}l@{\ }lll} &\mathrm{ N_2^+ + H_2 \rightarrow N_2H^+ + H} \qquad & (\mathrm{R_a5}),\\[4pt] &\mathrm{ N^+ + H_2 \rightarrow NH^+ + H} \qquad & (\mathrm{R_a6}), \end{array} \end{equation*}](/articles/aa/full_html/2021/06/aa40268-20/aa40268-20-eq15.png) (5)
(5)
and the DR reaction:
 (6)
(6)
Except for the two photodissociation processes, Ra7 produces the hottest H atoms among the above reactions with a kinetic energy of 8.22 eV.
H2: Hot H2 could be substantially produced via CH4 photodissociation, including two branches:
![Mathematical equation: \begin{equation*} \begin{array}{@{}l@{\ }lll} \mathrm{ CH_4 + h\nu} & \rightarrow \mathrm{CH + H_2 + H} \qquad &(\mathrm{R_b1}), \\[4pt] &\mathrm{ \rightarrow C + H_2 + H_2} \qquad &(\mathrm{R_b2}), \end{array} \end{equation*}](/articles/aa/full_html/2021/06/aa40268-20/aa40268-20-eq17.png) (7)
(7)
with the former also producing substantial hot H as described above. Below 100 km, H2 is also formed from H via the three-body reaction:
 (8)
(8)
and the reaction with NH:
 (9)
(9)
The reaction producing the hottest H2 atoms is (Rb3), with a kinetic energy of 1.41 eV.
C: The production of hot C in Triton’s atmosphere is very complicated and contributed by a large number of reactions. At 50− 200 km, the dominant channel is the neutral-neutral reaction:
 (10)
(10)
whereas at higher altitudes, two DR reactions:
![Mathematical equation: \begin{equation*} \begin{array}{@{}l@{\ }lll} &\mathrm{ CHCN^+ + e \rightarrow C + HCN} \qquad & (\mathrm{R_c6}),\\[4pt] &\mathrm{ CO^+ + e \rightarrow C + O} \qquad & (\mathrm{R_c7}), \end{array} \end{equation*}](/articles/aa/full_html/2021/06/aa40268-20/aa40268-20-eq21.png) (11)
(11)
become more important and at lower altitudes, the neutral-neutral reaction:
 (12)
(12)
and one CH4 photodissociation channel (Rb 2, as quoted above) produce the majority of hot C atoms. Reaction (Rc3) also produces hot H2, but it is much less important than the major channels discussed above and is therefore not considered in this study. Outside of photodissociation, Rc 6 produces the hottest C atoms with a kinetic energy of 4.99 eV.
N: Hot N production occurs mainly via EI dissociation of N2 :
 (13)
(13)
which is strongly suppressed below 400 km and, thus, the photodissociation and dissociative photoionisation of N2,
![Mathematical equation: \begin{equation*} \begin{array}{@{}l@{\ }lll} &\mathrm{ N_2 + h\nu \rightarrow N + N} &\qquad \mathrm{(R_d1)}, \\[4pt] &\mathrm{ N_2 + h\nu \rightarrow N + N^+ + e} &\qquad \mathrm{(R_d2)}, \end{array} \end{equation*}](/articles/aa/full_html/2021/06/aa40268-20/aa40268-20-eq24.png) (14)
(14)
become more important. Above 300 km, the DR reaction:
 (15)
(15)
also contributes significantly to hot N production, whereas below 150 km, the neutral-neutral reaction:
 (16)
(16)
is the dominant channel producing hot N. Another important ion-neutral reaction for N production:
 (17)
(17)
as proposed by Krasnopolsky & Cruikshank (1995), is not considered in this study because it is endothermic.
O: For hot O production, the most important channel below 250 km is CO photodissociation:
 (18)
(18)
which is also the third most important channel for C production below 60 km, and the neutral-neutral reaction:
 (19)
(19)
Above 250 km, hot O production is mainly contributed by two DR reactions:
![Mathematical equation: \begin{equation*} \begin{array}{@{}l@{\ }lll} &\mathrm{ CO^+ + e \rightarrow C + O} \qquad \mathrm{(R_e3)},\\[4pt] &\mathrm{ NO^+ + e \rightarrow N + O} \qquad \mathrm{(R_e4)}. \end{array} \end{equation*}](/articles/aa/full_html/2021/06/aa40268-20/aa40268-20-eq30.png) (20)
(20)
of which the latter reaction produces the hottest O atoms at 1.29 eV (outside of photodissociation). It is noteworthy that these two DR reactions also produce substantial hot C and N at high altitudes.
N2: Hot N2 is mainly produced via the DR reaction:
 (21)
(21)
and the ion-neutral reaction:
 (22)
(22)
above 250 km, and via another ion-neutral reaction:
 (23)
(23)
as well as three neutral-neutral reactions:
![Mathematical equation: \begin{equation*} \begin{array}{@{}l@{\ }lll} &\mathrm{ N + N + M \rightarrow N_2 + M} \qquad & \mathrm{(R_f1)},\\[4pt] &\mathrm{ CNN + N \rightarrow N_2 + CN} \qquad & \mathrm{(R_f3)},\\[4pt] &\mathrm{ CNN + H \rightarrow N_2 + CH} \qquad & \mathrm{(R_f4)}, \end{array} \end{equation*}](/articles/aa/full_html/2021/06/aa40268-20/aa40268-20-eq34.png) (24)
(24)
at lower altitudes. The kinetic energy of hot N2 molecules produced in Triton’s atmosphere could reach a maximum value of 1.63 eV associated with the three body reaction (Rf 1). Reaction (Ra 4) is not considered in this study, because the estimated N2 kinetic energies (0.11 eV and 0.0056 eV for the ground and excited electronic states) are well below the respective escape energy on Triton.
CO: Hot CO production above 150 km is dominated by the ion-neutral reaction:
 (25)
(25)
and the DR reaction:
 (26)
(26)
whereas at lower altitudes, two neutral-neutral reactions:
![Mathematical equation: \begin{equation*} \begin{array}{@{}l@{\ }lll} &\mathrm{ CH_2 + O \rightarrow H_2 + CO} \qquad & \mathrm{(R_{g}1)},\\[4pt] &\mathrm{ CNN + O \rightarrow N_2 + CO} \qquad & \mathrm{(R_{g}2)}, \end{array} \end{equation*}](/articles/aa/full_html/2021/06/aa40268-20/aa40268-20-eq37.png) (27)
(27)
become the principal production channels. Reaction (Rg2) produces the hottest CO molecules with a kinetic energy of 1.61 eV. Reactions Rg 1 and Rg 3 are not considered here due to their relatively low production rates as compared to the other H2 production channels quoted above (Krasnopolsky & Cruikshank 1995). Another important neutral-neutral reaction:
 (28)
(28)
as proposed by Krasnopolsky & Cruikshank (1995), is not considered either because it produces CO molecules at 0.085 eV that are not able to escape from Triton.
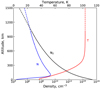 |
Fig. 1 Background neutral atmosphere of Triton for the two most abundant species, N2 and N, over the altitude range of 0–1500 km, along with the neutral temperature profile. The solid lines below 1000 km represent the model results of Krasnopolsky & Cruikshank (1995), whereas the dashed lines represent the extrapolated profiles assuming an isothermal atmosphere above 1000 km. |
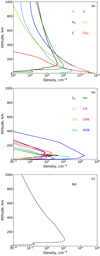 |
Fig. 2 Density profiles of various neutral species in Triton’s atmosphere involved in this study, including H, H2, C, O, CO, and CH2 in panel a, C2, CH, CH2, CH3, NH, CN, CNN, and HCN in panel b, as well as NO in panel c. |
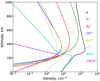 |
Fig. 3 Density profiles of electron and ion reactants involved in this study, all adapted from Krasnopolsky & Cruikshank (1995) and extrapolated to 1000 km assuming diffusive equilibrium. |
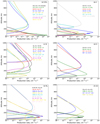 |
Fig. 4 Calculated production rates of hot neutrals considered in this study, with H and H2 in panel a, C, N, O, N2, and CO in panels b to f. |
3 Hot neutral escape probabilities
To rigorously calculate the escape rates, the escape probability profile for each species in Triton’s atmosphere is a requisite. The most convenient choice is to use the ideal exobase approximation (e.g. McElroy 1972; Cravens et al. 1997; De La Haye et al. 2007), which may produce an unrealistic sharp transition in escape probability from 0 to 0.5 at the exobase. Although some analytic models, such as the single-collision model of Cravens et al. (2017) and the multi-collision model of Cui et al. (2019), are able to reflect the smooth and continuous transition in escape probability near the exobase more appropriately, they are not able to predict escape probabilities exceeding 0.5 that are known to be present at high altitudes (e.g. Fox & Hać 2009, 2014, 2018). Therefore, we apply a more sophisticated Monte Carlo method to calculate the escape probabilities of hot neutrals produced via each chemical channel on Triton. The present test particle Monte Carlo model, which is capable of capturing the realistic behavior of escaping neutrals over a broad transition region near the exobase, is modified from our existing models of photochemical escape on Titan (Gu et al. 2020a) and non-thermal escape of light neutrals via knock-on by hot O on Mars and Venus (Gu et al. 2020b, 2021).
To make a distinction from the ideal plane parallel background atmosphere used in our previous calculations (Gu et al. 2020a), here we use a spherically symmetric background atmosphere that is based on the N2 and N density profiles displayed in Fig. 1 at 0–1500 km. This means that strictly horizontally propagating neutrals, which do not escape from a plane parallel atmosphere due to geometrical restriction, now have a non-negligible escape probability. Above 1500 km, the collision probability drops to less than 0.1%, implying that Triton’s atmosphere at these altitudes does not exert an appreciable influence on the derived escape probabilities. All inelastic processes such as excitation, ionisation, and dissociation (e.g. De La Haye et al. 2007; Gu et al. 2020a) are ignored in this study since the energy range encountered here is usually less than the respective threshold energies. In the present study, binary neutral collisions are characterised using the same scheme as in our previous studies of atmospheric escape on Mars and Venus (Gu et al. 2020b, 2021), taking into account energy-dependent and species-dependent cross-sections (e.g. Fox & Hać 2018), as well as a common strongly forward-scattering angle distribution (e.g. Kharchenko et al. 1997, 2000; Gacesa et al. 2020). To be more specific, we use the uniform formulism proposed by Fox & Hać (2018) for the binary collision cross section between neutral species i and j, denoted as σij, written as:
 (29)
(29)
where E is the relative kinetic energy in units of eV, aij and bij are two species-dependent free parameters to be constrained by laboratory measurements. We display in Table 1 the values of different collision parameters involved in this study, along with the corresponding references. For collisions without laboratory measurements, we estimate the respective parameters from the measured ones with the closest masses for both collision partners.
The entire background atmosphere of Triton between 0 and 1500 km is divided into 30 grids, each covering a depth of 50 km within which a large number of hot neutrals are initiated with different nascent kinetic energies. For hot neutrals produced from PI and EI processes, all nascent energies are realised to satisfy the respective energy distribution, while the nascent energies of hot neutrals from neutral–neutral, ion–neutral, and DR reactions are fixed according to the exothermicities listed in Table A.1 and the mass ratios of the reactants. The stepwise trajectory of each hot particle is then followed and its collisions with ambient N2 or N are realised in a stochastic manner according to the species-dependent and energy-dependent cross sections predicted by Eq. (29). The post-collision kinetic energies of hot neutrals are determined from the masses of the collision partners and a randomly chosen scattering angle that satisfies the distribution of Gacesa et al. (2020). The above procedure is repeated until the hot neutrals escape at the top of the atmosphere or until its kinetic energy falls below the local escape energy. For each independent model run imposed to a given escaping species and characterised by a unique combination of nascent energy and altitude of initial release, a total number of 100 000 test particles are simulated to achieve statistically robust results.
We show, in each panel of Fig. 5, the escape probability as a function of altitude for each escaping species and each chemical production channel detailed in Sect. 2, with the respective nascent kinetic energy provided in the figure legend (except for PI and EI processes with a continuous band of nascent energy). Figure 5 shows several distinctive features, which we address below in detail.
Firstly, except for the two lightest neutrals in panel (a), the modeled escape probability profiles typically render a broad transition region with a depth of about 300 km around the ideal exobase near 930 km (Johnson et al. 2008). Such a transition region on Triton is thicker than those of similar species on inner Solar System planets (e.g. Lillis et al. 2017) and on Titan (e.g. Gu et al. 2020a), with a depth of ~ 200 km, which is due to the stronger gravitational forces on these bodies. The escape probability is vanishingly small below the transition region, yet it is at around 0.5 above, which is in good agreement with the ideal behavior that all particles below the exobase are not able to escape, whereas all particles above the exobase and moving upward are able to escape (e.g. Chamberlain 1963). We also note that the actual escape probability at high altitudes might be slightly above the ideal value of 0.5 due to non-negligible backscattering (Fox & Hać 2009, 2014, 2018).
Secondly, it is obvious from Fig. 5 that more energetic hot neutrals are more likely to escape from Triton’s atmosphere at all altitudes. Such a variation can be interpreted by the fact that a more energetic particle is capable of making more collisions before it is mixed with the background atmosphere (Cui et al. 2019) because of a smaller collision probability and a higher nascent energy.
Finally, the escape probability varies substantially among different species due to the differences in both escape energy and collision cross section. To be more specific, the escape probabilities of light hot particles tend to be higher than those of heavy hot particles, as light ones are less likely to collide with ambient neutrals and are able to make more collisions before their energies fall below the local escape energy (e.g. Fox & Hać 2018; Gu et al. 2020a). For instance, the escape probabilities are ~ 0.8 for hot H at 1500 km – values that are to be compared with the probabilities of ~ 0.45 for hot N2 at the same altitude.
In our previous study of photochemical escape on Titan (Gu et al. 2020a), a common functional form was proposed to reasonably characterise any modeled escape probability profile, which is also adopted here and written as:
 (30)
(30)
where z is the altitude,  is the escape probability for reaction r and species i, h is a length scale that characterises the depth of the transition region, h0 is the central altitude of the transition region, and
  and
and  represent asymptotic escape probabilities at sufficiently low and high altitudes, respectively. Unrealistic negative values are sometimes obtained for
  to achieve satisfactory fits to the modeled escape probability profiles, indicating that Eq. (30) cannot be extrapolated to arbitrarily low altitudes. The escape probability profiles given by Eq. (30) are shown with the dashed lines in Fig. 5. The best-fit values of h, h0,
  , and
, and  are listed in Table A.2 for reference.
4 Hot neutral escape rates
In general, the escape rate for channel r and species i, denoted as  , can be calculated via
 (31)
(31)
where RT is Triton’s solid body radius,  is the hot neutral production rate, and all the other parameters are defined above. For each species, we provide in Table A.1 the escape rates via different channels, and the relative contributions of these channels are shown schematically in Fig. 6. The figure demonstrates clearly that the dominant channels vary substantially among different species, which we discuss below in detail.
H and H2: According to our calculations,the dayside total H and H2 escape rates on Triton driven by chemical reactions are 4.5 × 1024 s−1 and 2.6 × 10¹⁶ s−1, respectively.For atomic H, the most important channel is the ion-neutral reaction (Ra 6), which contributes to nearly 44% of total escape. The second most important channel is N2 H+ DR (Ra7) which accounts for about 35% of total H escape. Another ion–neutral reaction (Ra 5) also contributes appreciably to 21% of total H escape. The contributions from other channels are negligible. Despite the fact that CH4 photodissociation (Ra1 and Ra2) produces the bulk of hot H on Triton (Krasnopolsky & Cruikshank 1995), it makes little contribution to H escape because hot H produced from photodissociation is mainly located below 300 km, where the H escape probabilities are nearly zero (see Fig. 5). Meanwhile, CH4 photodissociation (Rb1 and Rb2) serves as the dominant channel for H2 escape, owing to the fact that other channels, such as the three-body reaction (Rb 3) and neutral–neutral reaction (Rb4), produce H2 at lower altitudes.
N and N2: The total chemically induced escape rates of N and N2 on Triton are 7.7 × 1024 s−1 and 1.4 × 10²³ s−1, respectively. In particular, N escape driven by chemistry occurs in a complicated manner, with five reactions making fractional contributions above 5%. Figure 6 shows clearly that the most important channel is EI dissociation of N2 (Rd 3), which contributes to ~ 36% of total N escape. The second most important channel is N2 photodissociation (Rd1), which accounts for ~31% of total N escape. The next two important channels are N DR (Rd8) and N2 dissociative photoionization (Rd2), contributing to ~13% and ~ 8% of total N escape, respectively. Besides, NO+ DR (Rd9) also contributes non-negligibly to ~5% of total N escape. For N2 escape, two reactions make the largest contributions, which are the ion-neutral reaction (Rf 7) and N2 H+ DR (Rf9), with respective fractional contributions of ~55% and ~45%.
C, O, and CO: Similarly to H2, C escape in Triton’s atmosphere occurs almost exclusively via one single channel, namely, CO+ DR (Rc 7), corresponding to a dayside escape rate of 6.8 × 10²² s−1. According to Fig. 6, the total O escape rate driven by chemistry is 1.4 × 10²³ s−1, partitioned between CO+ DR (Re3) and NO+ DR (Re 4), with fractional contributions of ~44% and ~56%. For CO, the total chemical escape rate is derived to be 5.5 × 10²⁰ s−1. The primarychannel is HCO+ DR (Rg5), which accounts for more than 90% of the total CO escape on Triton. Additionally, neutral–neutral reaction (Rg 4) also contributes non-negligibly to nearly 10% of total CO escape.
Parameters for energy-dependent elastic collision cross sections for different collision pairs in Triton’s atmosphere.
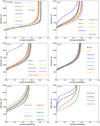 |
Fig. 5 Escape probability profiles for various hot neutrals with different nascent kinetic energies included in this study. Crosses are from test particle Monte Carlo calculations and the dashed lines indicate the best empirical fits (see text for details). |
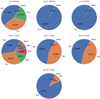 |
Fig. 6 Fractional contributions of different channels to the total escape rate of each hot species (H, H2, C, N, O, N2, and CO) involved in this study. In each panel, the total escape rate is provided, with 4.5(24) referring to 4.5 × 1024 s−1, for instance. |
5 Discussion and conclusions
Atmospheric escape from the atmospheres of most outer Solar System bodies is thought to be dominated by thermal escape (e.g. Johnson et al. 2008). However, non-thermal mechanisms may also play important roles for certain bodies, such as atmosphericand ionospheric chemistry on Titan (e.g. Cravens et al. 1997; De La Haye et al. 2007; Michael et al. 2005; Gu et al. 2020a), as well as atmospheric sputtering on Titan (e.g. Shematovich et al. 2001, 2003; Gu et al. 2019) and Io (e.g. Pospieszalska & Johnson 1996).
This study is devoted to a Monte Carlo evaluation of chemically induced atmospheric escape on Triton, including seven candidate escaping neutral species (H, H2, C, N, O, N2 and CO) released from 35 channels. For such a purpose, the model results of several previous works are used (Krasnopolsky et al. 1993; Krasnopolsky & Cruikshank 1995), including PI and EI processes, neutral–neutral, ion–neutral, and DR reactions, from which various hot neutral production rates could be derived. Due to the lack of available laboratory measurements, a crude scheme is used to account for the production of hot neutrals in excited states. For each species, a Monte Carlo approach is applied to further determine the escape probability profile using an energy-dependent, forward scattering collision model in analogy to our previous models of atmospheric escape on Mars and Venus (Gu et al. 2020b, 2021). Our model calculations indicate that due to a relatively weak gravity, Triton possesses a broader transition region in escape probability as compared to Mars and Venus.
For all species included in this study, atomic H and N exhibit the largest chemical escape rates, at the level of several 1024 s−1. This is followed by C, O, and N2, characterised by an escape rate of ~ 1022−1023 s−1, and then by CO, with an escape rate of ~ 1020 s−1. The escape rate of H2 is smallest among all species considered here, which is only at the order of 1016 s−1. In general, total H, C, N, and O escape rates on Triton driven by chemistry are 4.5 × 1024 s−1, 6.9 × 10²² s−1, 8.0 × 1024 s−1, and 1.4 × 10²³ s−1, respectively. Specifically, total H escape is partitioned among two ion-neutral reactions (Ra 5 and Ra 6) and N2 H+ DR, total C escape occurs almost exclusively via CO+ DR, total O escape is near equally contributed by CO+ and NO+ DR, whereas total N escape is complicated, with N2 EI dissociation being most important followed by N2 photodissociation and N DR.
DR.
It is instructive to compare the chemical escape rates derived here for various species to their respective Jeans escape rates. Specifically, the calculations of Strobel et al. (1990b) suggest a total H Jeans escape rate of 3.9 × 1025 s−1, including both H and H2. A later study by Krasnopolsky & Cruikshank (1995) estimated the H and H2 Jeans escape rates to be 2.4 × 1025 s−1 and 4.5 × 1025 s−1. By comparison, the chemical escape rate amounts to nearly 20% of the Jeans escape rate for atomic H, though completely negligible for H2. The C Jeans escape rate on Triton was derived to be 1.1 × 1024 s−1 (Krasnopolsky & Cruikshank 1995), which is an order of magnitude higher than the C chemical escape rate reported here. For atmospheric N and O on Triton, the Jeans escape rates are 7.7 × 1024 s−1 and 4.4 × 10²² s−1 (Krasnopolsky & Cruikshank 1995), respectively. Our derived escape rates are comparable for N and larger by more than a factor of 3 for O, suggesting that the chemical escape of these two species is important on Triton.
Finally, we caution that the escape rates that we obtain rely on the choice of the background atmospheric and ionospheric models, which may constitute an important source of uncertainty in our calculations. In the present study, all the reactions are adapted from Krasnopolsky & Cruikshank (1995), but several potentially important channels have been ignored in their model calculations. For instance, in our previous study of atmospheric escape on Titan (Gu et al. 2020a), another outer Solar System body also containing an N2 -dominant atmosphere, we showed that the quenching of N(2D) by N2 collision:
 (32)
(32)
is the primary channel of N and N2 escape driven by exothermic chemistry, but this process was not considered by Krasnopolsky & Cruikshank (1995) and, hence, its contribution to N escape cannot be evaluated here. Clearly, an improved understanding of atmospheric and ionospheric chemistry is required to pin down its contribution to total atmospheric escape on Triton.
Acknowledgements
This work is supported by the B-type Strategic Priority Program No. XDB41000000 funded by the Chinese Academy of Sciences (CAS) and the Key Research Program No. IGGCAS-201904 funded by the Institute of Geology & Geophysics, CAS. The authors also acknowledge supports from the National Natural Science Foundation of China through grants 41774186, 42030201, and 41904154, and from China’s National Space Administration through the Pre-research Project on Civil Aerospace Technologies No. D020105. The background atmosphere/ionosphere models underlying this article are based on Table 9 of Krasnopolsky et al. (1993) and Figs. 2–5 of Krasnopolsky & Cruikshank (1995).
Appendix A Supplementary information on the hot neutral production rates and escape probabilities
For easy reference, in this appendix we compile detailed information on the hot neutral production rates and escape probabilities used for deriving the escape rates. In Table A.1, we list all the 35 independent chemical channels involved in the present study, as well as the kinetic energy releases, ΔE (in units of eV), the rate coefficients, k (in units of s−1 for PI processes, cm3 s−1 for binary reactions, and cm6 s−1 for tertiary reactions, with T being the temperature in units of K), the dayside escape rates, Φ (in units of s−1), and the corresponding references, grouped by species. In Table A.2, we list various parameters, including ζ0, ζ1, h, and h0, used for describing the altitude dependence of escape probability according to Eq. (30) in Sect. 3 and constrained by the Monte Carlo model results.
Information on the chemical channels considered in this study that potentially produce escaping H, H2, C, N, O, N2, and CO in Triton’s dayside atmosphere.
References
- Anicich, V. G. 1993, J. Phys. Chem. Ref. Data, 22, 1469 [NASA ADS] [CrossRef] [Google Scholar]
- Balakrishnan, N., Kharchenko, V., & Dalgarno, A. 1998, J. Geophys. Res., 103, 23393 [CrossRef] [Google Scholar]
- Baulch, D. L., Cobos, C. J., Cox, R. A., et al. 1992, J. Phys. Chem. Ref. Data, 21, 411 [NASA ADS] [CrossRef] [Google Scholar]
- Baulch, D. L., Bowman, C. T., Cobos, C. J., et al. 2005, J. Phys. Chem. Ref. Data, 34, 757 [NASA ADS] [CrossRef] [Google Scholar]
- Berman, M. R., & Lin, M. C. 1984, J. Chem. Phys., 81, 5743 [CrossRef] [Google Scholar]
- Braun, W., Bass, A. M., Davis, D. D., et al. 1969, Proc. Roy. Soc. Lond. A, 312, 417 [CrossRef] [Google Scholar]
- Broadfoot, A. L., Atreya, S. K., Bertaux, J. L., et al. 1989, Science, 246, 1459 [NASA ADS] [CrossRef] [PubMed] [Google Scholar]
- Campbell, I. M., & Thrush, B. A. 1967, Proc. Roy. Soc. Lond. A, 296, 201 [CrossRef] [Google Scholar]
- Chamberlain, J. W. 1963, Planet. Space Sci., 11, 901 [NASA ADS] [CrossRef] [Google Scholar]
- Chan, W. F., Cooper, G., & Brion, C. E. 1993, Chem. Phys., 178, 401 [CrossRef] [Google Scholar]
- Cravens, T. E., Keller, C. N., & Ray, B. 1997, Planet. Space Sci., 45, 889 [NASA ADS] [CrossRef] [Google Scholar]
- Cravens, T. E., Rahmati, A., Fox, J. L., et al. 2017, J. Geophys. Res. (Space Phys.), 122, 1102 [NASA ADS] [CrossRef] [Google Scholar]
- Cui, J., Yelle, R. V., & Volk, K. 2008, J. Geophys. Res. (Planets), 113, E10004 [NASA ADS] [CrossRef] [Google Scholar]
- Cui, J., Yelle, R. V., Müller-Wodarg, I. C. F., et al. 2011, J. Geophys. Res. (Space Phys.), 116, A11324 [Google Scholar]
- Cui, J., Yelle, R. V., Strobel, D. F., et al. 2012, J. Geophys. Res. (Planets), 117, E11006 [NASA ADS] [CrossRef] [Google Scholar]
- Cui, J., Wu, X.-S., Gu, H., et al. 2019, A&A, 621, A23 [NASA ADS] [CrossRef] [EDP Sciences] [Google Scholar]
- Cui, J., Fu, M.-H., Ren, Z.-P., et al. 2020, Geophys. Res. Lett., 47, e87252 [CrossRef] [Google Scholar]
- Dalgarno, A., Babb, J. F., & Sun, Y. 1992, Planet. Space Sci., 40, 243 [CrossRef] [Google Scholar]
- De La Haye, V., Waite, J. H., Cravens, T. E., et al. 2007, Icarus, 191, 236 [NASA ADS] [CrossRef] [Google Scholar]
- Dubinin, E., Fraenz, M., Fedorov, A., et al. 2011, Space Sci. Rev., 162, 173 [CrossRef] [Google Scholar]
- Fox, J. L., & Hać, A. B. 2009, Icarus, 204, 527 [NASA ADS] [CrossRef] [Google Scholar]
- Fox, J. L., & Hać, A. B. 2014, Icarus, 228, 375 [NASA ADS] [CrossRef] [Google Scholar]
- Fox, J. L., & Hać, A. B. 2018, Icarus, 300, 411 [NASA ADS] [CrossRef] [Google Scholar]
- Gacesa, M., & Kharchenko, V. 2014, J. Chem. Phys., 141, 164324 [CrossRef] [Google Scholar]
- Gacesa, M., Lillis, R. J., & Zahnle, K. J. 2020, MNRAS, 491, 5650 [CrossRef] [Google Scholar]
- Gladstone, G. R., & Young, L. A. 2019, Ann. Rev. Earth Planet. Sci., 47, 119 [CrossRef] [Google Scholar]
- Gu, H., Cui, J., Niu, D.-D., et al. 2019, A&A, 623, A18 [NASA ADS] [CrossRef] [EDP Sciences] [Google Scholar]
- Gu, H., Cui, J., Lavvas, P. P., et al. 2020a, A&A, 633, A8 [CrossRef] [EDP Sciences] [Google Scholar]
- Gu, H., Cui, J., Niu, D., et al. 2020b, ApJ, 902, 121 [CrossRef] [Google Scholar]
- Gu, H., Cui, J., Niu, D., et al. 2021, MNRAS, 502, 2394 [CrossRef] [Google Scholar]
- Harding, L. B., Guadagnini, R., & Schatz, G. C. 1993, J. Phys. Chem., 97, 5472 [CrossRef] [Google Scholar]
- Heays, A. N., Visser, R., Gredel, R., et al. 2014, A&A, 562, A61 [NASA ADS] [CrossRef] [EDP Sciences] [Google Scholar]
- Hellberg, F., Rosén, S., Thomas, R., et al. 2003, J. Chem. Phys., 118, 6250 [CrossRef] [Google Scholar]
- Hunten, D. M., & Watson, A. J. 1982, Icarus, 51, 665 [Google Scholar]
- Jakosky, B. M., Brain, D., Chaffin, M., et al. 2018, Icarus, 315, 146 [NASA ADS] [CrossRef] [Google Scholar]
- Johnson, R. E., Combi, M. R., Fox, J. L., et al. 2008, Space Sci. Rev., 139, 355 [NASA ADS] [CrossRef] [Google Scholar]
- Kharchenko, V., Tharamel, J., & Dalgarno, A. 1997, J. Atm. Solar-Terrest. Phys., 59, 107 [CrossRef] [Google Scholar]
- Kharchenko, V., Dalgarno, A., Zygelman, B., et al. 2000, J. Geophys. Res., 105, 24899 [NASA ADS] [CrossRef] [Google Scholar]
- Krasnopolsky, V. A. 1999, J. Geophys. Res., 104, 5955 [CrossRef] [Google Scholar]
- Krasnopolsky, V. A., & Cruikshank, D. P. 1995, J. Geophys. Res., 100, 21271 [NASA ADS] [CrossRef] [Google Scholar]
- Krasnopolsky, V. A., Sandel, B. R., Herbert, F., et al. 1993, J. Geophys. Res., 98, 3065 [NASA ADS] [CrossRef] [Google Scholar]
- Lammer, H., Kasting, J. F., Chassefière, E., et al. 2008, Space Sci. Rev., 139, 399 [NASA ADS] [CrossRef] [Google Scholar]
- Lean, J. 1991, Rev. Geophys., 29, 505 [NASA ADS] [CrossRef] [Google Scholar]
- Lewkow, N. R., & Kharchenko, V. 2014, ApJ, 790, 98 [CrossRef] [Google Scholar]
- Lillis, R. J., Brain, D. A., Bougher, S. W., et al. 2015, Space Sci. Rev., 195, 357 [NASA ADS] [CrossRef] [Google Scholar]
- Lillis, R. J., Deighan, J., Fox, J. L., et al. 2017, J. Geophys. Res. (Space Phys.), 122, 3815 [NASA ADS] [CrossRef] [Google Scholar]
- McElroy, M. B. 1972, Science, 175, 443 [NASA ADS] [CrossRef] [Google Scholar]
- McElroy, M. B., & McConnell, J. C. 1971, J. Geophys. Res., 76, 6674 [NASA ADS] [CrossRef] [Google Scholar]
- McNutt, R. L. 1989, Geophys. Res. Lett., 16, 1225 [CrossRef] [Google Scholar]
- Michael, M., Johnson, R. E., Leblanc, F., et al. 2005, Icarus, 175, 263 [NASA ADS] [CrossRef] [Google Scholar]
- Miller, J. A., Branch, M. C., McLean, W. J., et al. 1985, Symposium (International) on Combustion Proceedings, 20, 673 [CrossRef] [Google Scholar]
- Mitchell, J. B. A. 1990, Phys. Rep., 186, 215 [NASA ADS] [CrossRef] [Google Scholar]
- Mordaunt, D. H., Lambert, I. R., Morley, G. P., et al. 1993, J. Chem. Phys., 98, 2054 [NASA ADS] [CrossRef] [Google Scholar]
- Morley, C. 1981, Symposium (International) on Combustion Proceedings, 18, 23 [CrossRef] [Google Scholar]
- Peterson, J. R., Le Padellec, A., Danared, H., et al. 1998, J. Chem. Phys., 108, 1978 [NASA ADS] [CrossRef] [Google Scholar]
- Pospieszalska, M. K., & Johnson, R. E. 1996, J. Geophys. Res., 101, 7565 [NASA ADS] [CrossRef] [Google Scholar]
- Rosén, S., Peverall, R., Larsson, M., et al. 1998, Phys. Rev. A, 57, 4462 [NASA ADS] [CrossRef] [Google Scholar]
- Samson, J. A. R., Masuoka, T., Pareek, P. N., et al. 1987, J. Chem. Phys., 86, 6128 [CrossRef] [Google Scholar]
- Shaw, D. A., Holland, D. M. P., MacDonald, M. A., et al. 1992, Chem. Phys., 166, 379 [NASA ADS] [CrossRef] [Google Scholar]
- Shematovich, V. I., Tully, C., & Johnson, R. E. 2001, Adv. Space Res., 27, 1875 [NASA ADS] [CrossRef] [Google Scholar]
- Shematovich, V. I., Johnson, R. E., Michael, M., et al. 2003, J. Geophys. Res. (Planets), 108, 5087 [NASA ADS] [CrossRef] [Google Scholar]
- Sittler, E. C., & Hartle, R. E. 1996, J. Geophys. Res., 101, 10863 [CrossRef] [Google Scholar]
- Stolte, W. C., He, Z. X., Cutler, J. N., et al. 1998, Atom. Data Nuclear Data Tables, 69, 171 [CrossRef] [Google Scholar]
- Strobel, D. F. 2008, Icarus, 193, 588 [CrossRef] [Google Scholar]
- Strobel, D. F. 2009, Icarus, 202, 632 [NASA ADS] [CrossRef] [Google Scholar]
- Strobel, D. F., Cheng, A. F., Summers, M. E., et al. 1990, Geophys. Res. Lett., 17, 1661 [CrossRef] [Google Scholar]
- Strobel, D. F., Summers, M. E., Herbert, F., et al. 1990, Geophys. Res. Lett., 17, 1729 [CrossRef] [Google Scholar]
- Strobel, D. F., Zhu, X., Summers, M. E., et al. 1996, Icarus, 120, 266 [NASA ADS] [CrossRef] [Google Scholar]
- Summers, M. E., & Strobel, D. F. 1991, Geophys. Res. Lett., 18, 2309 [CrossRef] [Google Scholar]
- Tian, F., & Toon, O. B. 2005, Geophys. Res. Lett., 32, L18201 [Google Scholar]
- Torr, M. R., & Torr, D. G. 1985, J. Geophys. Res., 90, 6675 [NASA ADS] [CrossRef] [Google Scholar]
- Tsang, W., & Hampson, R. F. 1986, J. Phys. Chem. Ref. Data, 15, 1087 [NASA ADS] [CrossRef] [Google Scholar]
- Tyler, G. L., Sweetnam, D. N., Anderson, J. D., et al. 1989, Science, 246, 1466 [NASA ADS] [CrossRef] [Google Scholar]
- Visser, R., van Dishoeck, E. F., & Black, J. H. 2009, A&A, 503, 323 [NASA ADS] [CrossRef] [EDP Sciences] [Google Scholar]
- Whyte, A. R.,& Phillips, L. F. 1983, Chem. Phys. Lett., 98, 590 [NASA ADS] [CrossRef] [Google Scholar]
- Wu, X.-S., Cui, J., Xu, S. S., et al. 2019, J. Geophys. Res. (Planets), 124, 734 [CrossRef] [Google Scholar]
- Yelle, R. V., Cui, J., & Müller-Wodarg, I. C. F. 2008, J. Geophys. Res. (Planets), 113, E10003 [NASA ADS] [CrossRef] [Google Scholar]
- Zhu, X., Strobel, D. F., & Erwin, J. T. 2014, Icarus, 228, 301 [NASA ADS] [CrossRef] [Google Scholar]
All Tables
Parameters for energy-dependent elastic collision cross sections for different collision pairs in Triton’s atmosphere.
Information on the chemical channels considered in this study that potentially produce escaping H, H2, C, N, O, N2, and CO in Triton’s dayside atmosphere.
All Figures
|
Fig. 1 Background neutral atmosphere of Triton for the two most abundant species, N2 and N, over the altitude range of 0–1500 km, along with the neutral temperature profile. The solid lines below 1000 km represent the model results of Krasnopolsky & Cruikshank (1995), whereas the dashed lines represent the extrapolated profiles assuming an isothermal atmosphere above 1000 km. |
| In the text | |
|
Fig. 2 Density profiles of various neutral species in Triton’s atmosphere involved in this study, including H, H2, C, O, CO, and CH2 in panel a, C2, CH, CH2, CH3, NH, CN, CNN, and HCN in panel b, as well as NO in panel c. |
| In the text | |
|
Fig. 3 Density profiles of electron and ion reactants involved in this study, all adapted from Krasnopolsky & Cruikshank (1995) and extrapolated to 1000 km assuming diffusive equilibrium. |
| In the text | |
|
Fig. 4 Calculated production rates of hot neutrals considered in this study, with H and H2 in panel a, C, N, O, N2, and CO in panels b to f. |
| In the text | |
|
Fig. 5 Escape probability profiles for various hot neutrals with different nascent kinetic energies included in this study. Crosses are from test particle Monte Carlo calculations and the dashed lines indicate the best empirical fits (see text for details). |
| In the text | |
|
Fig. 6 Fractional contributions of different channels to the total escape rate of each hot species (H, H2, C, N, O, N2, and CO) involved in this study. In each panel, the total escape rate is provided, with 4.5(24) referring to 4.5 × 1024 s−1, for instance. |
| In the text | |
Current usage metrics show cumulative count of Article Views (full-text article views including HTML views, PDF and ePub downloads, according to the available data) and Abstracts Views on Vision4Press platform.
Data correspond to usage on the plateform after 2015. The current usage metrics is available 48-96 hours after online publication and is updated daily on week days.
Initial download of the metrics may take a while.