Fig. 1
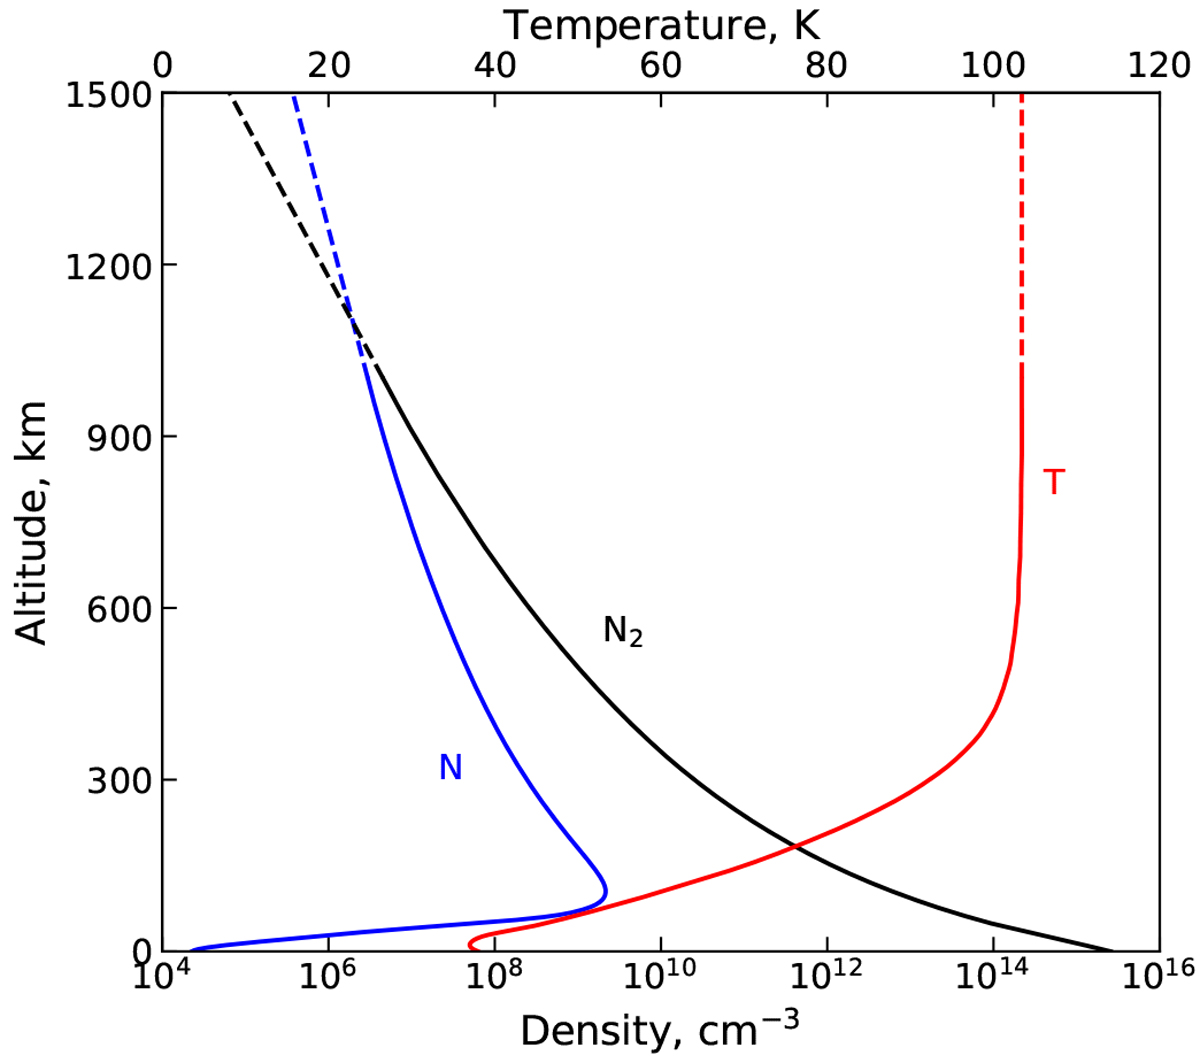
Background neutral atmosphere of Triton for the two most abundant species, N2 and N, over the altitude range of 0–1500 km, along with the neutral temperature profile. The solid lines below 1000 km represent the model results of Krasnopolsky & Cruikshank (1995), whereas the dashed lines represent the extrapolated profiles assuming an isothermal atmosphere above 1000 km.
Current usage metrics show cumulative count of Article Views (full-text article views including HTML views, PDF and ePub downloads, according to the available data) and Abstracts Views on Vision4Press platform.
Data correspond to usage on the plateform after 2015. The current usage metrics is available 48-96 hours after online publication and is updated daily on week days.
Initial download of the metrics may take a while.