Fig. 9.
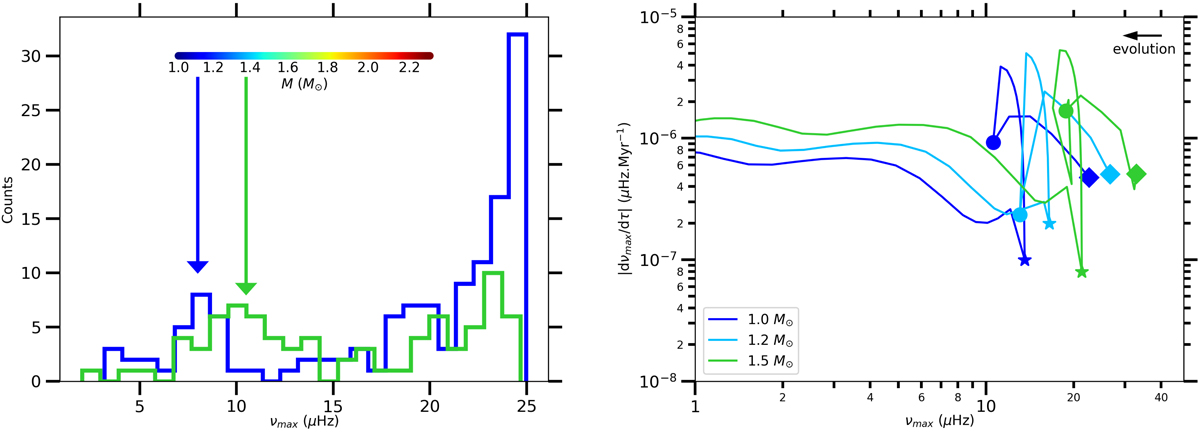
Left panel: distribution of He-burning stars in terms of νmax. In blue we show the number of low-mass He-burning stars (M ≤ 1.2 M⊙), and in green we show the number of high-mass He-burning stars (M ≥ 1.2 M⊙). The colour bar indicates the location in νmax where we expect the AGB bump for a given mass following Eq. (19) and adopting Teff = 4800(νmax/40.0)0.06 (Mosser et al. 2010). The blue and green arrows roughly indicate the location of the AGB bump for low-mass and high-mass stars, respectively, which is characterised by a local excess of stars. Right panel: Evolution speed dνmax/dτ, where τ is the stellar age, as a function of νmax for different stellar masses. The models computed with MESA start from the end of the clump phase, which is marked by a diamond. The start and the end of the AGB bump are marked by a circle and a star, respectively.
Current usage metrics show cumulative count of Article Views (full-text article views including HTML views, PDF and ePub downloads, according to the available data) and Abstracts Views on Vision4Press platform.
Data correspond to usage on the plateform after 2015. The current usage metrics is available 48-96 hours after online publication and is updated daily on week days.
Initial download of the metrics may take a while.