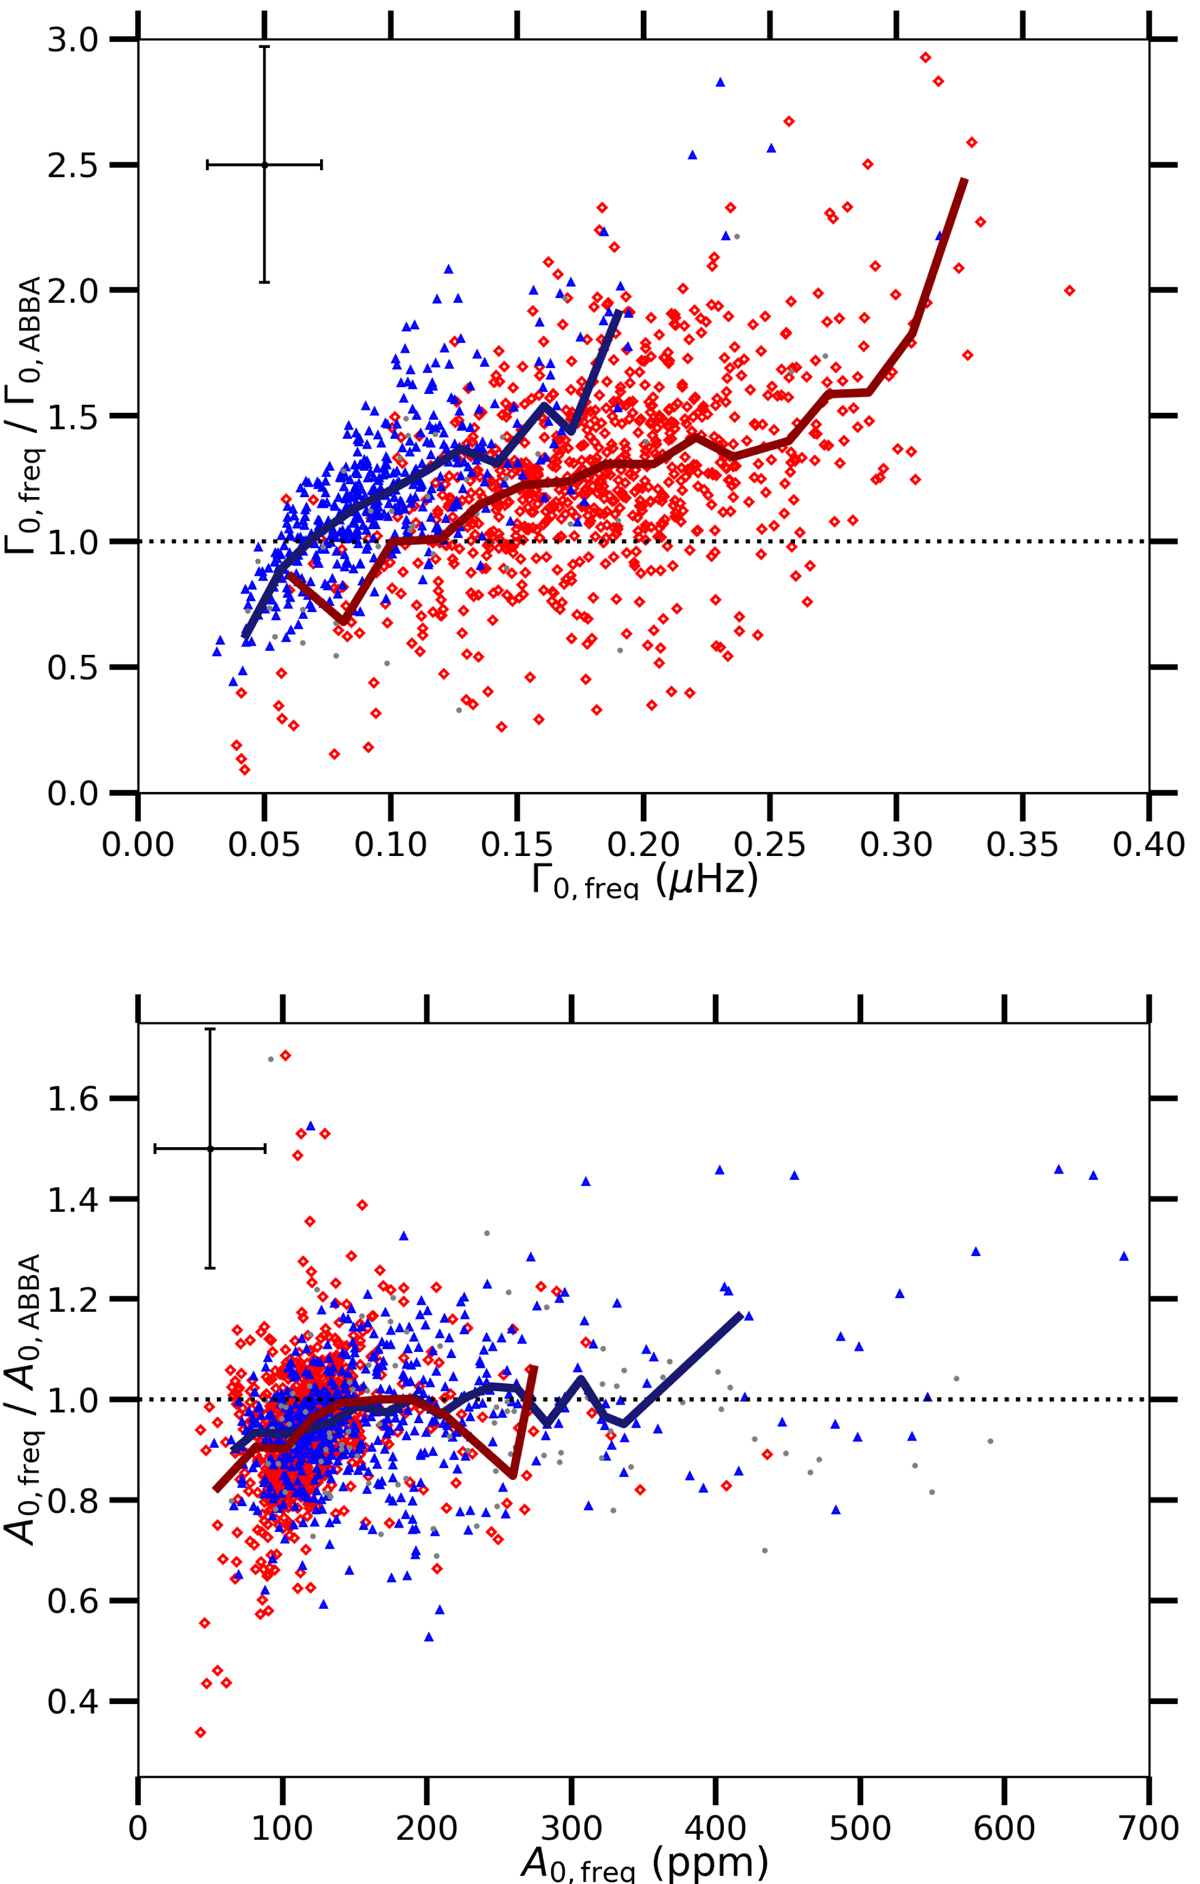
Fig. 8.

Top panel: ratio of the average radial mode widths ⟨Γ0⟩ obtained in this study and those obtained with a Bayesian method (Kallinger 2019). The median values are computed in 0.015 μHz wide Γ0, freq bins. Bottom panel: same as in the upper panel, but for the average radial mode bolometric amplitude ⟨A0, bol⟩. The colours and symbols are the same as in Fig. 4. The median values are computed in 20 ppm A0, freq bins. The dotted line represents the 1:1 agreement. Mean error bars are represented at the top of each panel.
Current usage metrics show cumulative count of Article Views (full-text article views including HTML views, PDF and ePub downloads, according to the available data) and Abstracts Views on Vision4Press platform.
Data correspond to usage on the plateform after 2015. The current usage metrics is available 48-96 hours after online publication and is updated daily on week days.
Initial download of the metrics may take a while.


