Fig. 5.
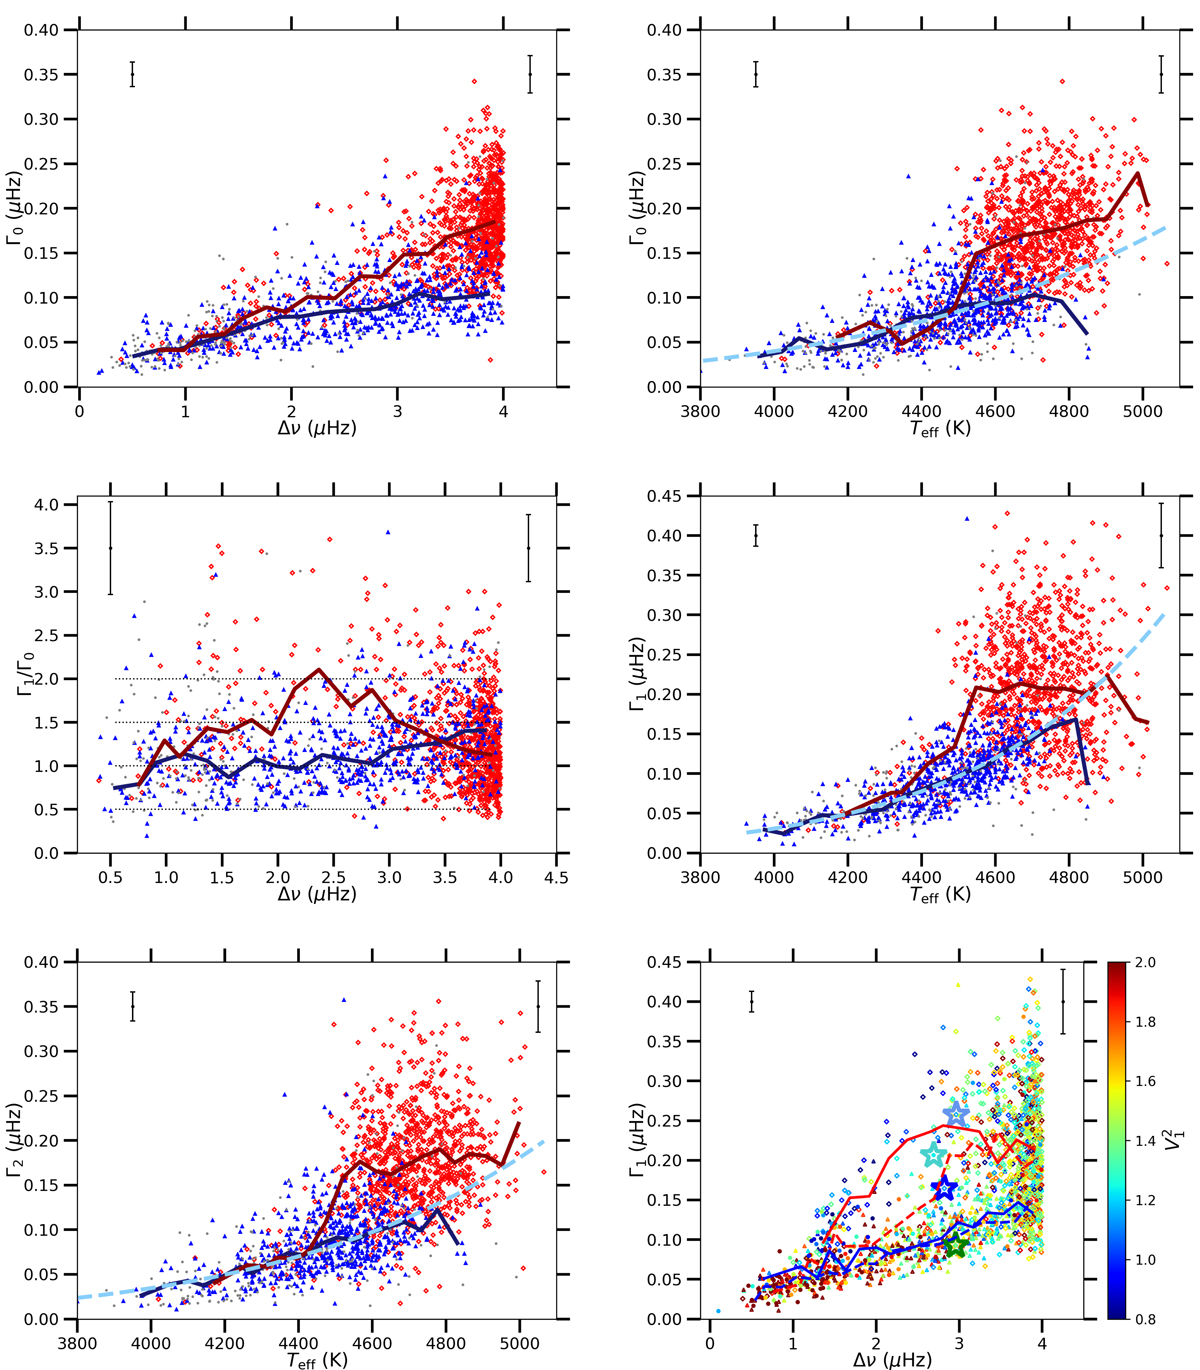
Upper panels: ⟨Γ0⟩ as a function of Δν and Teff. Middle panels: ratio of ⟨Γ1⟩ and ⟨Γ0⟩ as a function of Δν and ⟨Γ1⟩ as a function of Teff. For convenience, horizontal dotted black lines are plotted at specific values of 0.5, 1.0, 1.5, and 2.0. Bottom left panel: ⟨Γ2⟩ as a function of Teff. The colours and symbols are the same as in Fig. 4. Mean error bars on the widths have been computed both at low Teff (Teff ≤ 4200 K) and at high Teff (Teff ≥ 4200 K). These limits are equivalent to the limits in Δν chosen in Fig. 3. The fits presented in Table 3 are plotted with dashed light blue lines for RGB stars. Bottom right: ⟨Γ1⟩ as a function of Δν with the dipole mode visibilities colour-coded. The solid and dashed lines correspond to the median values for low-visibility dipole modes (![]() ) and for high-visibility dipole modes (
) and for high-visibility dipole modes (![]() ), respectively, in blue for RGB stars and in red for He-burning stars. The turquoise, dark blue, light blue and green stars are the individual stars KIC 6847371, KIC 11032660, KIC 5461447, and KIC 6768042, respectively. They are studied in Sect. 5.3 to test the reliability of the measurements of the dipole mode width. The median values are computed in 0.2 μHz wide Δν bins and in 50 K wide Teff bins.
), respectively, in blue for RGB stars and in red for He-burning stars. The turquoise, dark blue, light blue and green stars are the individual stars KIC 6847371, KIC 11032660, KIC 5461447, and KIC 6768042, respectively. They are studied in Sect. 5.3 to test the reliability of the measurements of the dipole mode width. The median values are computed in 0.2 μHz wide Δν bins and in 50 K wide Teff bins.
Current usage metrics show cumulative count of Article Views (full-text article views including HTML views, PDF and ePub downloads, according to the available data) and Abstracts Views on Vision4Press platform.
Data correspond to usage on the plateform after 2015. The current usage metrics is available 48-96 hours after online publication and is updated daily on week days.
Initial download of the metrics may take a while.