Fig. 4.
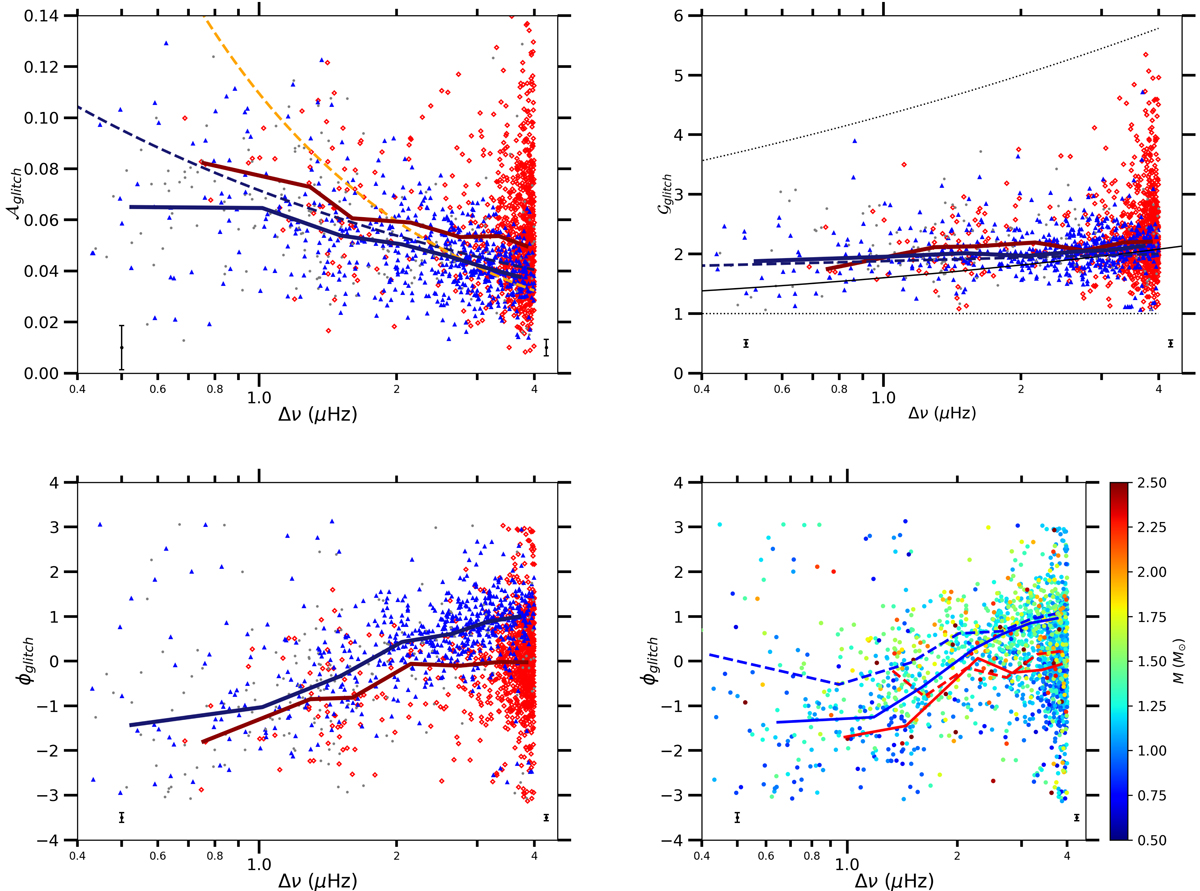
Modulation amplitude 𝒜, modulation period 𝒢, and modulation phase Φ as a function of Δν, with the same labels as in Fig. 3. The thick solid lines are the median values in 0.5 μHz Δν bins, shown in blue for RGB stars and in red for He-burning stars. In the upper panels, dashed blue lines are the fits presented in Table 2. In the upper left panel, the dashed orange line is the fit obtained for less evolved stars (Vrard et al. 2015), corrected with a factor that accounts for the differences between the methods we used to fit the modulation as described in Sect. 4.2. In the upper right panel, dotted black lines delimit the domain of reliable measurements of 𝒢, which are described in Sect. 3, and the thin solid line is the modulation period inferred from MESA models for a 1 M⊙ star and starting from the RGB up to the AGB. The error bars are computed in the same way as in Fig. 3. In the lower right panel, the stellar mass is colour-coded, and medians are represented by solid lines for low-mass stars (M ≤ 1.2 M⊙) and by dashed lines for high-mass stars (M ≥ 1.2 M⊙). Because Φ varies with stellar evolution, we calculated the medians for RGB and He-burning stars separately. We show them in blue for RGB and in red for He-burning stars.
Current usage metrics show cumulative count of Article Views (full-text article views including HTML views, PDF and ePub downloads, according to the available data) and Abstracts Views on Vision4Press platform.
Data correspond to usage on the plateform after 2015. The current usage metrics is available 48-96 hours after online publication and is updated daily on week days.
Initial download of the metrics may take a while.