Fig. 3.
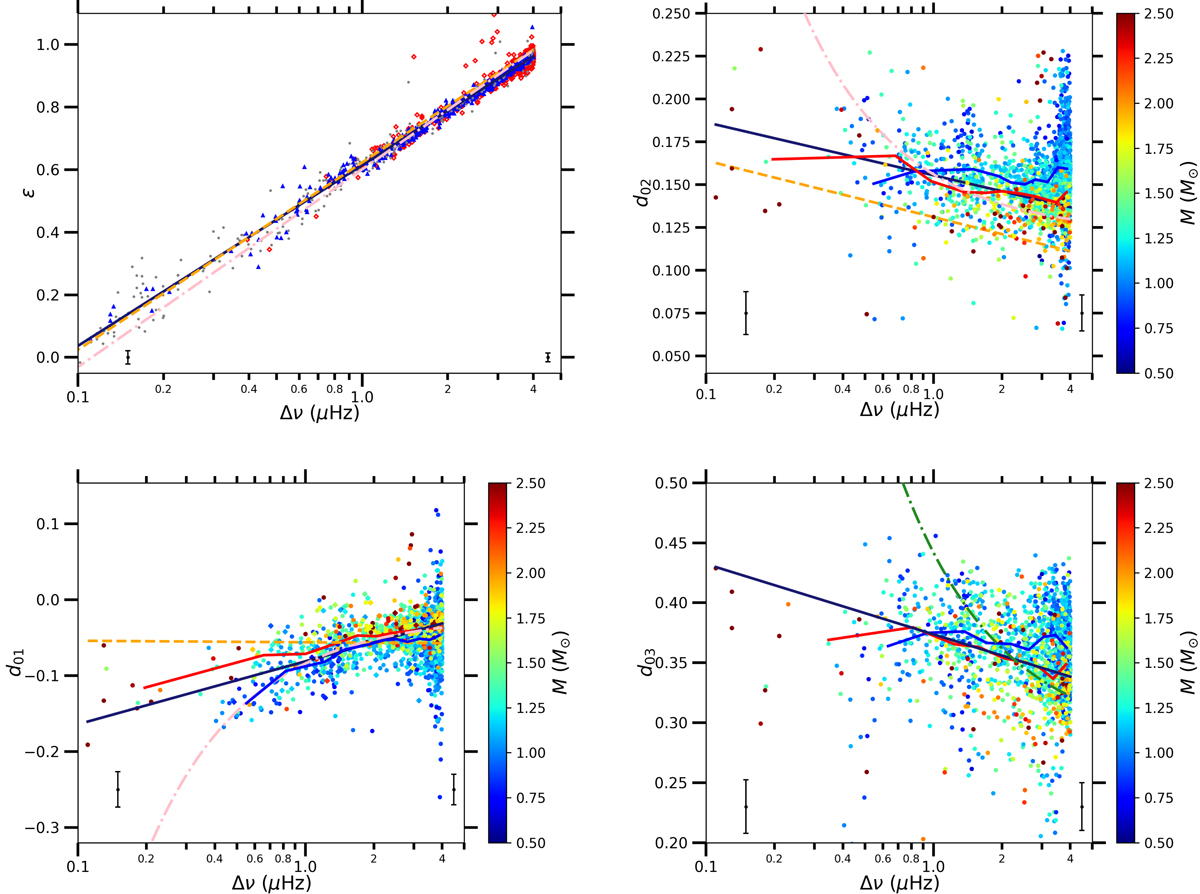
Seismic parameters of the asymptotic pattern of red giants (Eq. (1)) after adjusting Δν with the best-matching template following the procedure described in Sect. 3. Upper left panel: acoustic offset ε as a function of Δν, where blue triangles indicate RGB stars and red diamonds He-burning stars. Stars with either an unidentified evolutionary stage or disagreement between the two classification methods described in Sect. 2 are represented in grey. Upper right panel: reduced small separation d02 as a function of Δν; the stellar mass is colour-coded. Bottom panels: same labels as for the upper right panel, but for d01 and d03 as a function of Δν. The solid blue and red lines are the median values in 0.4 μHz Δν bins for low-mass stars (M ≤ 1.2 M⊙) and for high-mass stars (M ≥ 1.2 M⊙), respectively. The dashed orange lines represent the scaling relations from Mosser et al. (2013a), and the solid dark blue lines are the scaling relations derived in this study (listed in Table 2). The dot-dashed pink and dark green lines correspond to the scaling relations for less evolved stars from Corsaro et al. (2012) and Huber et al. (2010), respectively. Mean error bars estimated at low Δν (Δν ≤ 1.0 μHz) and at high Δν (Δν ≥ 1.0 μHz) are represented at the bottom of each panel.
Current usage metrics show cumulative count of Article Views (full-text article views including HTML views, PDF and ePub downloads, according to the available data) and Abstracts Views on Vision4Press platform.
Data correspond to usage on the plateform after 2015. The current usage metrics is available 48-96 hours after online publication and is updated daily on week days.
Initial download of the metrics may take a while.