Fig. 6
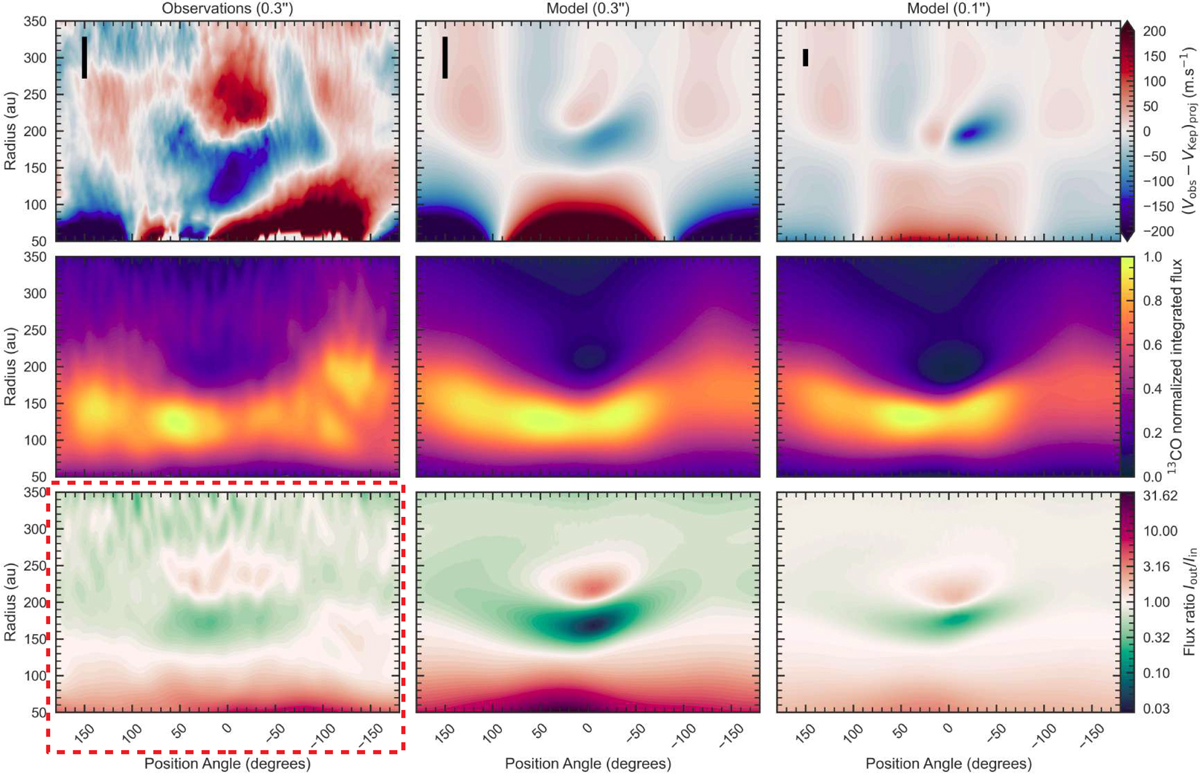
Artificial velocity deviations measured in a perfectly Keplerian disk compared to the observations. Top: differences between the measured 13CO J = 3–2 velocity and the Keplerian prescription in a 2D-map (R, θ). Blue and red colors indicate blue- and redshifted velocities along the line-of-sight compared to the Keplerian rotation. Middle: 13CO integrated emission. Bottom: flux ratio Iout∕Iin of the emission at the outer and inner edges of the synthesized beam. The left panel is surrounded by a red rectangle because theflux ratio is only an approximation in observations, being measured after beam smoothing. Left column shows the observations. The central and the right columns are the models convolved at a spatial resolution of 0.3 and 0.1′′. The verticalblack bar on the top-left corner of the top panels is the averaged radial spatial resolution as a function of the azimuth.
Current usage metrics show cumulative count of Article Views (full-text article views including HTML views, PDF and ePub downloads, according to the available data) and Abstracts Views on Vision4Press platform.
Data correspond to usage on the plateform after 2015. The current usage metrics is available 48-96 hours after online publication and is updated daily on week days.
Initial download of the metrics may take a while.